Plot Window Time Series Display
The Professional license provides the capability to display individual plots, objects (e.g., arrows, boxes, circles) and text on the plot so that they are appear in a specified order and frequency. Each frame of the display can be separately saved to a file so that a movie can be made using Microsoft Movie Maker or similar applications.
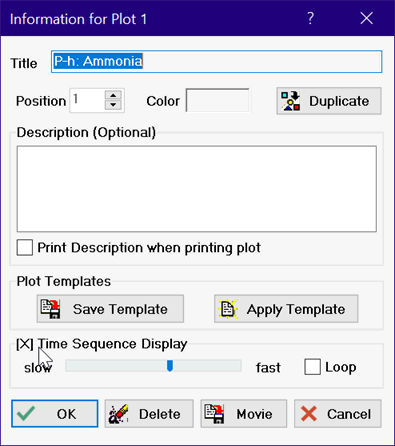
To enable the time series display, right click on the tab at the top of the plot window. A dialog, similar to that appearing below, will appear.

Click in the box preceding the words Time Series. A check will appear before the word when time series display is enabled. Click again to disable the display. The display speed can be set from slow (one frame every 5 sec) to fast (one frame every 0.02 sec) with the slider control. If the Loop checkbox is enabled, the display started by clicking the left mouse button at a point outside the plot rectangle, will loop indefinitely. The looping capability can also be set with the Loop button on the time series display control panel (see below). If the plot window is saved by clicking the Save button when time series display is enabled, each time series frame will be saved in a separate file.
If Time Series display has been enabled, the control panel shown below will be visible on the plot window. The first button starts the display. The second pauses the display at the current frame. The third button stops the display and resets it. The last button controls looping. If the button is depressed, as shown, looping is enabled. Click the button to disable looping.
![]()
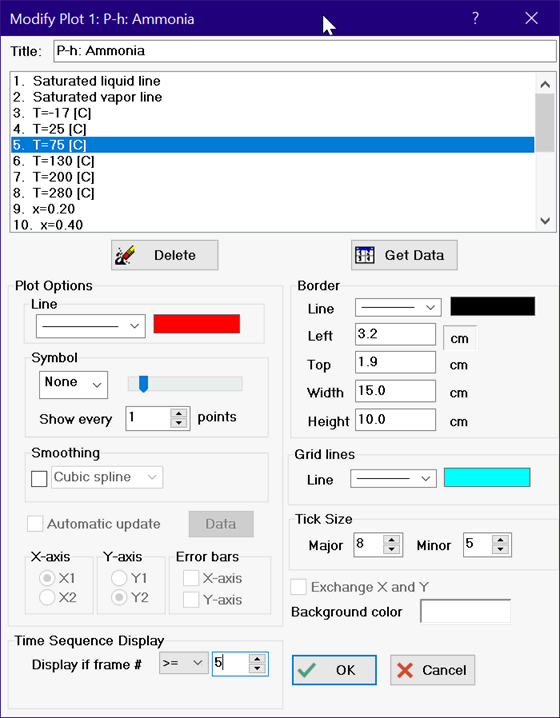
When time series display is enabled, controls to set the content in each frame will be visible in the plot dialogs. For example, when you right-click in the plot window (or select Modify Plot from the Plot menu) you will see the Modify Plot dialog with time series controls, as shown below.

Each plot overlay can be displayed in a separate frame. The frames are numbered in sequential order. Frame 0 is reserved for items that will be displayed in all frames. The frame for which the plot is to appear is set in the animation group box. If the setting is >= 5, as above, the selected plot will appear in frame 5 and remain visible in successive plots. IF the setting is = 5, the plot will only be shown in frame 5. The frame numbers are set by default to 0, indicating that they are shown in all frames.
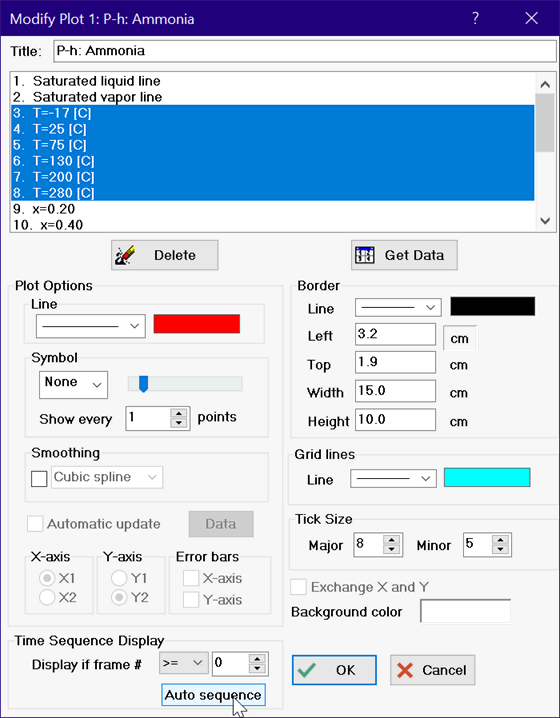
Note that it is possible to select multiple plots and set their frame numbers sequentially. To do this, click on the first plot of interest. Hold the Shift key down and then click on the last plot. All of the plots between these limits will be selected. The figure below shows six constant temperature lines selected in this manner.

When more than one plot line is selected, the Time Sequence Display controls will include an Auto sequence button, as shown above. Clicking this button will sequentially set the frame number of each selected plot line to a sequential integer, starting with 1. In this example, the frame numbers of the constant temperature plots lines are set to values of 1(for T=17 C]) to 6 (for T=280 C). Clicking the play button will display each of the constant temperature lines, one at time. If the control above the Auto sequence button is set to >=, the previously line is retained as the next line is drawn.
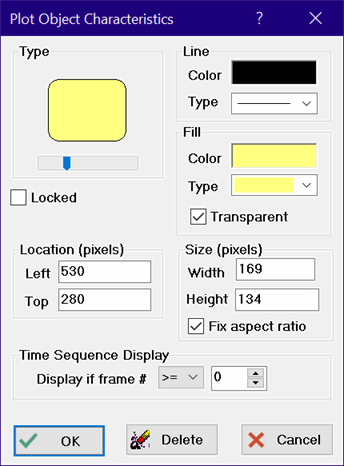
Similar capability is provided for plot objects and text. Right clicking on a plot object or text will bring up a dialog in which the frame number can be specified. Frame numbers for plot objects and text are, by default, set to zero so that they appear in all frames. Changing the frame number in the time series group box will allow the object or text to be selectively shown in separate frames.

Return to Plot windows