Contents
- Index
Property Plots Using the EES_REFPROP interface
An EES_REFPROP button is provided in the Property Plot dialog (Plots menu). The plotting capability requires an EES_REFPROP interface version dated May 27, 2022 or later. The date of your EES_REFPROP interface can be determined using the EES_REFPROP_DATE$ function. See the EES_REFPROP information on our website if you need to update your EES_REFPROP interface.
Select the Property Plot command from the Plots menu. Then, click the EES_REFPROP button at the upper right.
Unit System
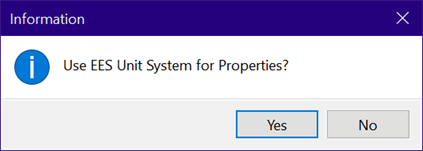
The default unit set used in the EES_REFPROP interface is temperature in K, pressure in kPa, and all specific properties, e.g., enthalpy, expressed on a molar basis. You can change this unit system by entering a $ConvertEESREFPROPUnits directive in the Equations window. Alternatively (and more simply), the first time you use the Property Plot, EES will provide the option to construct the property plot using the unit system defined in EES .
The figures that follow assume that the EES unit system was selected and that it was set with:
$UnitSystem SI K kPa kJ mass
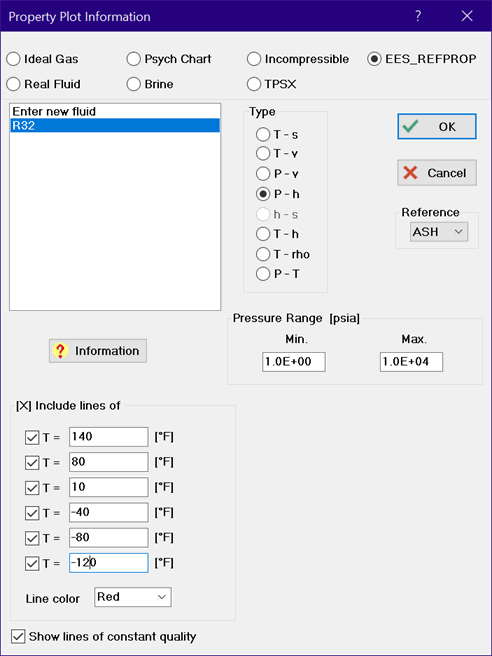
The Property Plot dialog will appear as shown the first time it is accessed.
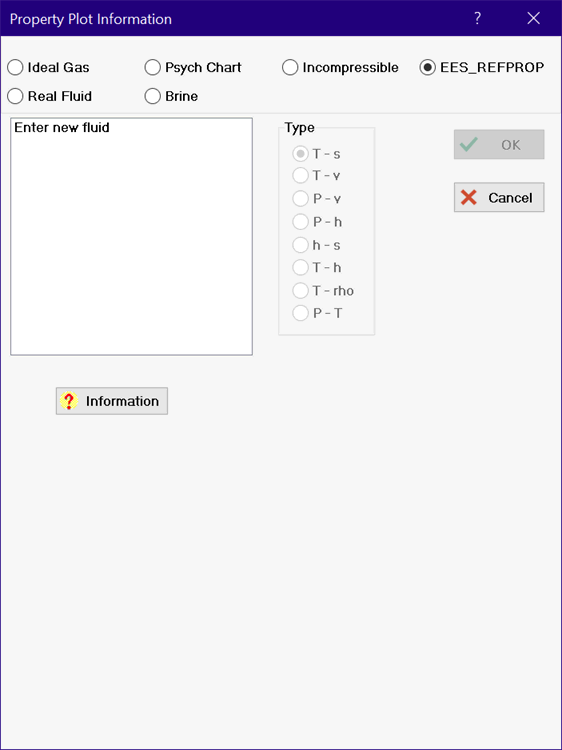
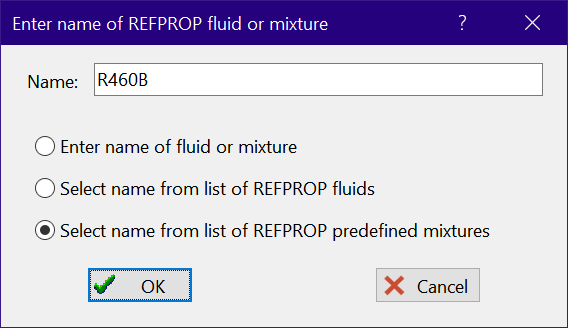
Click on Enter new fluid in the list box. A dialog will appear prompting you to enter the name of a pure fluid or fluid mixture that is recognized by the REFPROP program. There are three radio buttons. If the first button is selected, you can type the name of the fluid or mixture into the edit box. The second and third buttons will provide a list of the pure fluids and predefined mixtures, respectively, in the REFPROP directory. To activate the list, click the mouse within the edit box. Select the fluid or mixture of interest. Note that you can also create a new mixture and save it within REFPROP and then use the name of the mixture. For example, select the predefined mixture R460B.
The fluid will be entered into the name list box. Select the type of plot you wish to prepare. A dialog will appear below the name list box with suggested values for lines of another property. You can edit values for these lines or uncheck the boxes if you do not want the lines to appear. A P-h plot is selected for R460B. Note that you can use numerical values or previously defined EES variables to specify the lines of constant temperature and entropy.
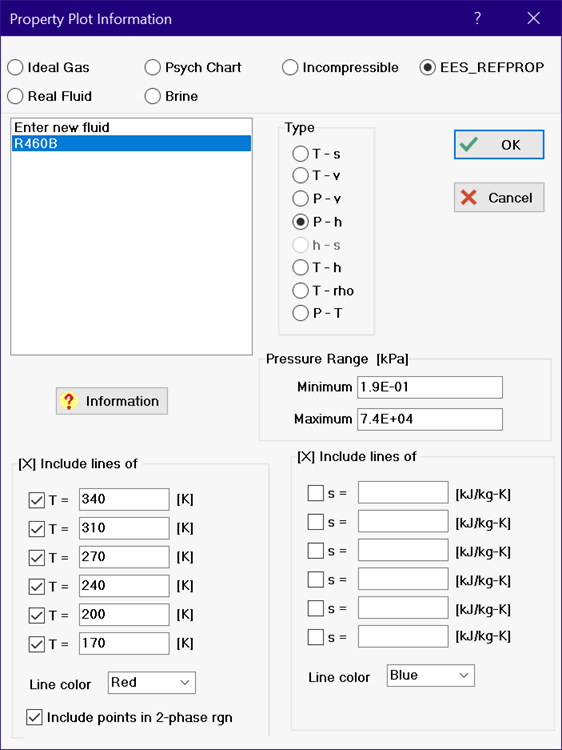
The constant temperature lines on the plot include the subcooled, saturated and superheated zones. By default, a straight line will be drawn between the saturated liquid and saturated vapor points. This is surely a good choice for pure fluids because the pressure and temperature are not affected by the quality. However, for zeotropic mixtures, such as R460B, the temperature for saturated liquid at a given pressure differs from that for saturated vapor at the same pressure. The EES_REFPROP interface dated May 3, 2023 or later provides an option to calculate points within the 2-phase region. That option has been selected, as shown in the above figure.
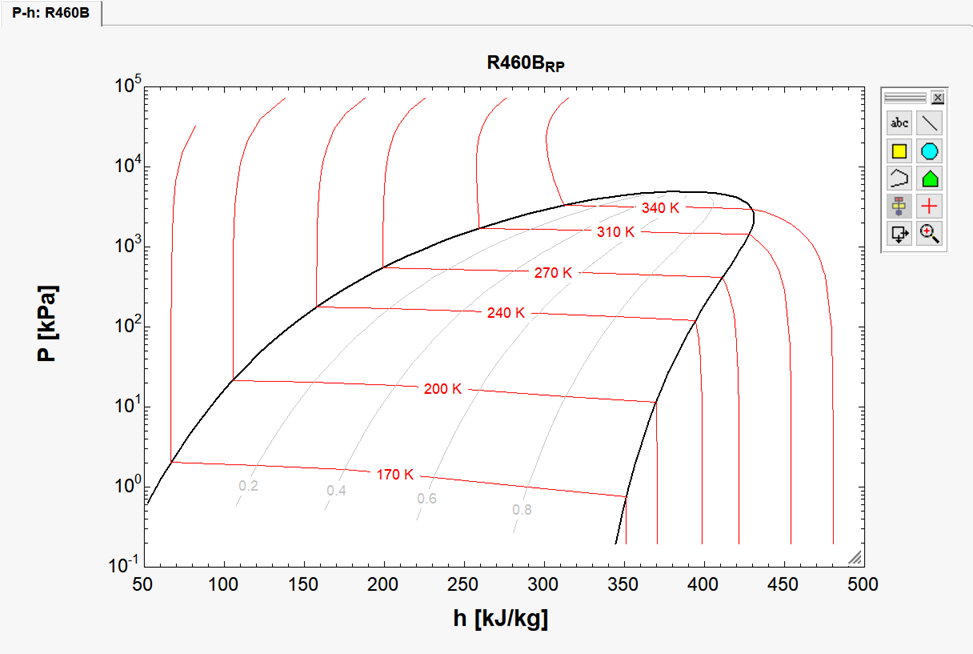
Click the OK button to produce the plot.
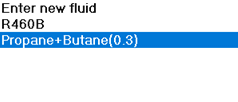
You can also create a mixture and plot the properties by entering the names of the fluids separated by a plus sign. For example, to produce a plot of a mixture of propane and butane, click on Enter new fluid and then enter
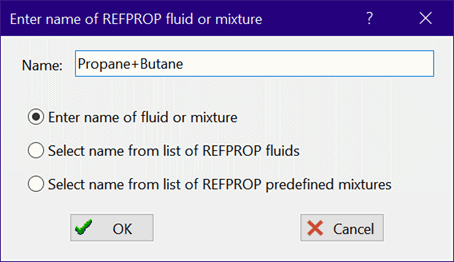
You will next be prompted to enter the mole fractions for all but the last fluid. With a binary mixture, only one mole fraction is needed. A 30% propane (molar basis) mixture is indicated here.
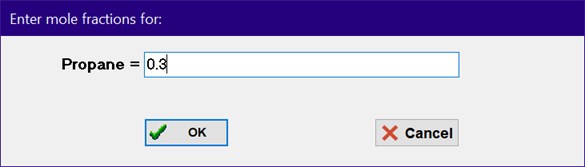
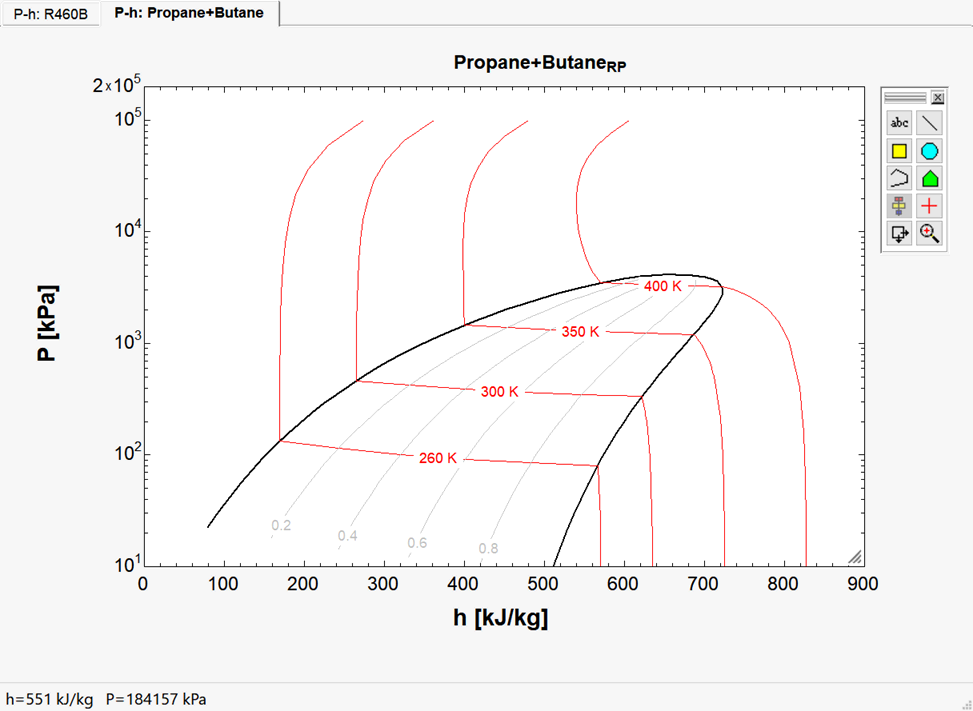
After selecting OK, the fluid mixture will be displayed in the list box with the N-1 mole fraction shown in parentheses.
Note that the minimum pressure for the plot is set to 1.2e-2 kPa. Such low pressures may not be of interest. Change the minimum pressure to 10 kPa and clicking OK to produce the following P-h plot.
Specify Composition on a Mass Basis
By default, the composition of mixtures generated by specifying a name with the pure fluids separated by the + symbol is normally expressed by providing the mole fractions for all but the last component. However, if the /Mass option is provided with the $ConvertEESREFPROPUnits directive, the composition is entered with mass fractions. The mass fractions are converted to mole fractions and shown with the name of the fluid.
$ConvertEESREFPROPUnits /Mass
Reference Values
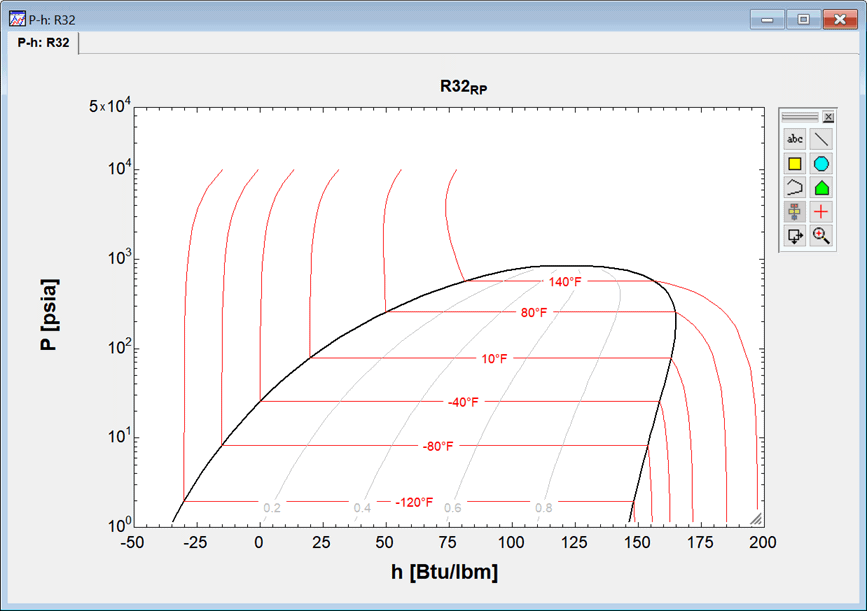
Specific enthalpy and entropy values are always based on an arbitrary reference value. The actual values of specific enthalpy and entropy do not matter since only differences in the values between two states are needed in a correctly formulated problem. However, it may be convenient to have the values referred to a common reference state. EES provides the capability of setting the reference state with the $REFERENCE directive. If the reference state for a fluid has been set with the $Reference directive, the property plot will use that same reference state to construct the plot. Note that the reference state is set when the EES_REFPROP interface is called, so at least one call must be executed before using the Property Plot command. The following example illustrates this capability using English units and the ASHRAE reference state for which specific enthalpy is 0 for saturated liquid at -40 F.
$UnitSystem Eng F psia mass
$Reference R32_rp ASH
MW=molarmass(R32_rp)
T[1]=-40 [F]
P[1]=pressure(R32_rp,T=T[1],x=0)
h[1]=enthalpy(R32_rp,T=T[1],x=0)
{Solving, MW=52.02 kg/kmol, P[1]=25.73 psia, h[1]=0 Btu/lb_m}
The Property Plot command accepts input values in the selected unit system.
The specific enthalpy values in the P-h plot will be relative to the selected reference state.