ModifyPlot (Macro Command)
ModifyPlot Name='my Plot' Left=1.5 in Top=70 px Width=12 cm Height=15 cm GridColor=Teal Toolbar=Visible PlotNo=1 LineStyle=1 Color=Blue Symbol=2 SymbolSize=6 SymbolEvery=1 AutoUpdate=On Position=2 ConnectLastToFirst
This macro command can be used to change many of the characteristics of a plot. It is the macro equivalent of the Modify Plot menu command.
Each characteristic is identified with a keyword and = sign. Most of the keywords are optional and they can be provided in any order, but Name should be first and PlotNo should precede the plot line characteristics.
Name is the name of the plot window as displayed on the tab at the top of the plot window. Then name can be provided with a string constant surrounded by single quotes or a predefined EES string variable. Alternatively, an integer can be provided indicating the plot tab number, e.g., Name=1 will indicate the first plot window. Name=0 implies that specified plot is the foremost plot, i.e., the one that is currently displayed.
Left and Top refer to left and top of the plot rectangle, relative to the plot window. Left and Top must be followed with cm, in, or px. (px refers to pixels. There are typically 96 or 120 pixels per inch on the screen.)
Width and Height refer to the width and height of the plot rectangle. Width and Height must be followed with cm, in or px.
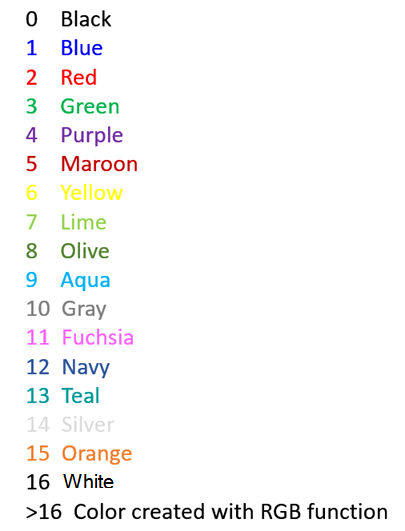
GridColor refers to the color of the grid lines. The grid color may be a recognized color name or an integer numerical value referring to the RGB number of the color.
Toolbar controls the access to the plot window toolbar. It must be followed with either hidden or visible.
PlotNo is needed when the plot contains several plot lines. The first plot is number 1. All of the plot line characteristic, e.g., LineStyle, LineColor, Symbol, etc. refer to the plot that is specified with PlotNo.
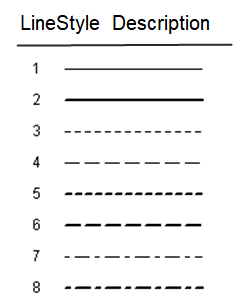
LineStyle refers to type of line used to draw the plot. It must be an integer or a predefined EES variable that has a value ranging between 0 and 9. The relation when the integer value and line style type is as follows.
Color refers to the color of the plot line and symbols. It may be a recognized color name.or an integer numerical value referring to the RGB number of the color.
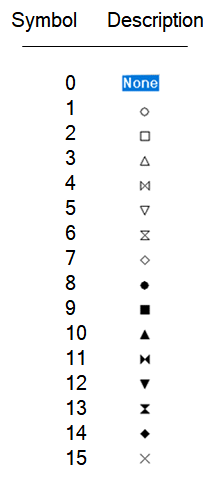
Symbol controls the type of symbol that is drawn at the location of each plotted point for the specified plot line. It must be an integer or a predefined EES variable that has a value ranging between 0 and 15. The relation when the integer value and symbol type is as follows.
SymbolSize is set with an integer or predefined EES variable with values ranging from 2(small) to 36 (large). Setting Symbol size to 0 or 1 will result in no visible symbol.
SymbolEvery controls the frequency of the displayed plot symbols. By default, a plot symbol is placed at each point. This corresponds to SymbolEvery=1. Setting SymbolEvery to 2 results in a plot symbol at every other point. The value supplied may be an integer or a predefined EES variable.
AutoUpdate must be following by On or Off. This characteristic controls the ability of EES to automatically update a plot when the data used to develop it are changed.
Position indicates the position of the plot tab for the specified plot. If position is set to 1, the plot will be the first in the plot window with the plot tab at the leftmost location.
ConnectLasttoFirst will cause a line to be drawn from the last plotted point to the first point. This option is useful when plotting thermodynamic cycles.
See also: NewPlot