VectorPlot2D and VectorPlot3D (Macro Command)
This macro command can be used to create 2D or 3D vector plots. The format is
VectorPlot2D Name='My 2D Plot' A:0/black B:!/red {for a 2D plot}
VectorPlot3D Name='My3D Plot' A:0/black B:!/red {for a 2D plot}
Name=
Sets the name of the tab for this plot window to the string constant or variable following the = sign. The string constant must be surrounded with single quotes. This keyword is required. If a plot having the same name as that provided after the = sign exists, the plot will be deleted and replaced with the plot generated by this macro command.
Vector Name:Origin pairs
The vectors that are to be plotted are provided after the plot name. Note that each vector must previously appear in a $Vector or $Vector3D directive and the vector must be determined. The origin of each vector is provided by separating the vector name and origin with a colon (no spaces). The origin can be designated as:
0 {indicates that the origin is the zeros vector}
! {indicates that the origin is the head of the last vector that was plotted}
Vector name {indicates that the origin is the value of this vector}
The vector name:origin pair may be optionally followed by the / character and a color name. The vector will be shown in the specified color if it is provided; otherwise it will be shown in black. The available colors are
Black
Blue
Red
Green
Purple
Maroon
Yellow
Lime
Olive
Aqua
Gray
Fuchsia
Navy
Teal
Silver
Orange
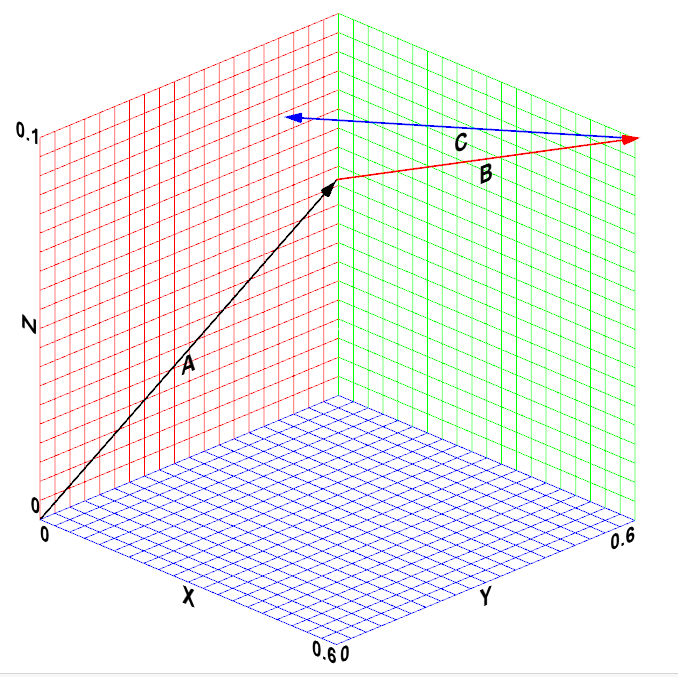
Example:
$Vector A, B, C
A=VectorAssign(0.4, 0.2, 0.1) [m] "point of application for force A"
B=VectorAssign(0.2,0.4,0) [m] "point of application of force B"
C=VectorAssign(-0.4,-0.3,0) [m] "point of application of force C"
$RunMacroAfter
VectorPlot3D Name='my3DPlot' A:0 B:A/red C:!/blue
$endmacro
See also: Vectors