PLOTCOORD
The PlotCoord function returns the relative position of a plotted point. The format is
PlotCoord(PlotName$,Axis$,V)
PlotName$ is the name of the plot that is displayed on the tab at the top of the plot window. This parameter can be a string constant within single quotes or a predefined string variable.
Axis$ indicates which axis the value refers to. Axis$ can be 'X', 'X1', 'X2', 'Y', 'Y1', or 'Y2'. The 2 refers to the 2nd axis if present. For example, Y2 refers to the axis on the right of the plot. This parameter can be a string constant within single quotes or a predefined string variable.
V is the value on the specified axis of the specified plot for which the position is returned.
The relative position returned by the function is a number which will be between 0 and 1 if the point is within the plot rectangle. A result of 0 for the X axis indicates that the point is at the left of the plot and 1 indicates it is at the top. For the Y axis, a value of 0 indicates that the point is at the bottom of the plot and 1 is at the top. Values less than 0 or greater than 1 indicate that the point is not within the plot rectangle.
This function is most useful when used with the AddPlotLine or AddPlotText macro command so that line or text may be placed at a specific position on the plot.
Example:
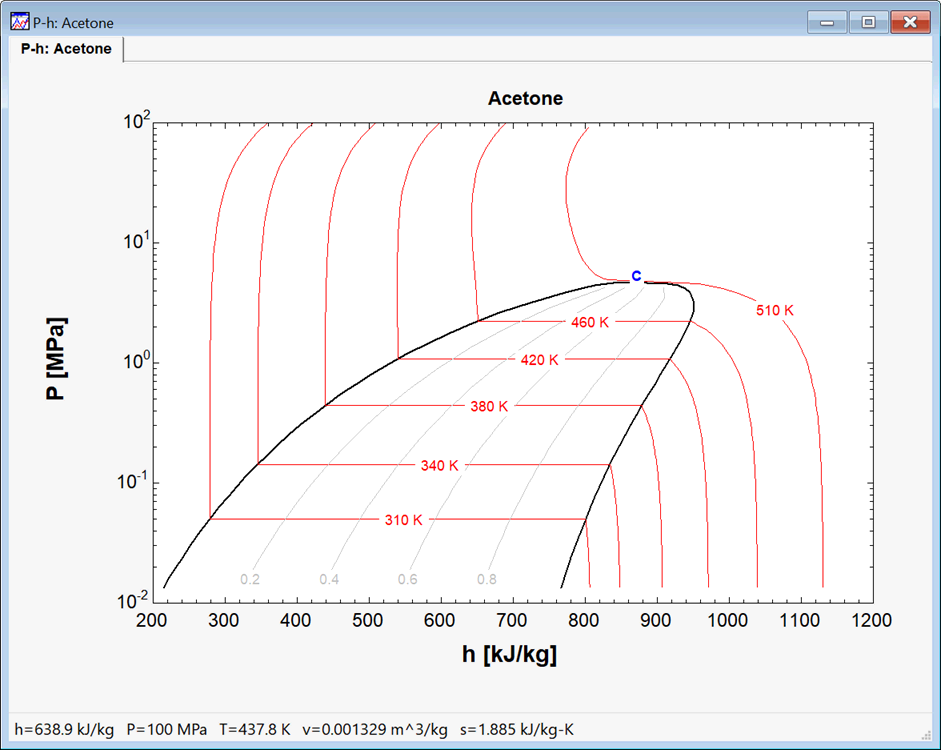
{This example will use a macro to display a P-h plot and place a blue 'C' to mark the critical point}
$UnitSystem SI K
$RunMacroAfter)
DeletePlot 1
F$='Acetone'
PropPlot F$ PH 6 310 340 380 420 460 510 0 DoQLines
P=P_crit(F$)
h=enthalpy(F$,P=P,x=1)
P$=PlotTabName$(0)
XPos=PlotCoord(P$, 'X', h)
YPos=PlotCoord(P$, 'Y', P)
AddPlotText P$ X=XPos Y=YPos Text='C' Color=Blue Style=Bold Size=18
$endMacro