Curve Fit Table Results Dialog
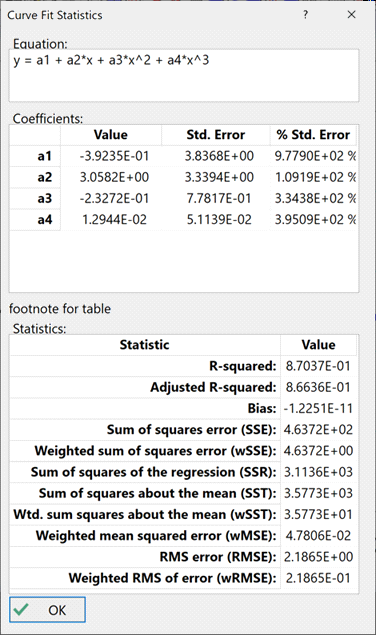
Once a curve fit has been established, the quality of the fit can be assessed by examining the results in the Curve Fit Table Results Dialog.

The values of the best fit coefficients and their standard error (expressed both as an absolute and relative value) are reported in the upper table. The lower table provides various statistics.
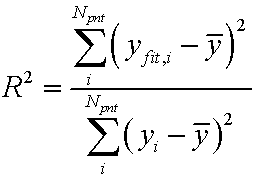
The R^2 value:
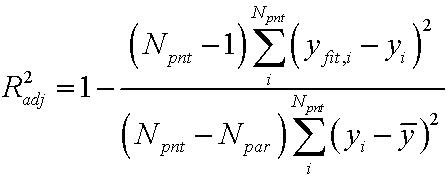
The adjusted R^2 value:
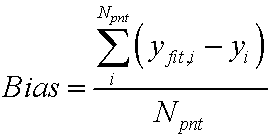
The Bias:
The sum of squared errors:

The weighted sum of squared errors:

The sum of squares of the regression:

The sum of squares about the mean:

The weighted sum of squares about the mean:

The mean squared error:

The weighted mean squared error:

The RMS error:

The weighted RMS error:

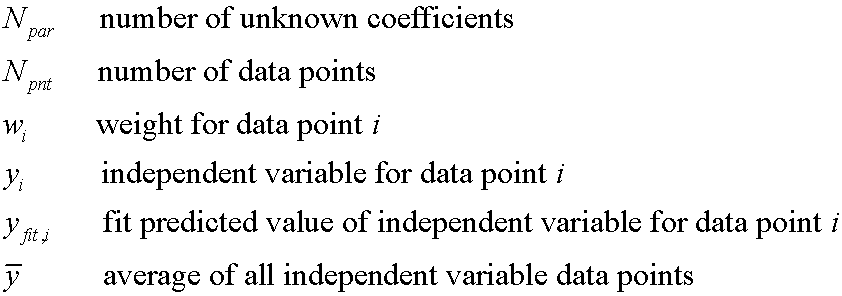
In the equations above the symbols refer to:
