Plotting Strings
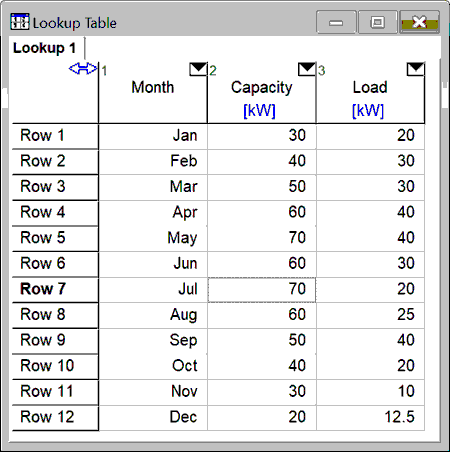
In some situations, it is convenient to display strings rather than numerical values on the X-axis of an X-Y or Bar plot. For example, a Lookup table can contain the following data. Note that it is necessary to set the format of the Month column to String in order to enter string data. This is done by clicking the right mouse button in the column header and selecting the Properties item from the pop-up menu to bring up the Format Table Column dialog.

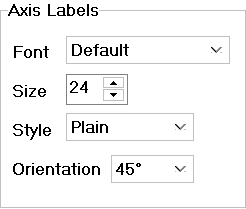
If the Month column is selected for the X-Axis in the Plot Setup dialog, the usual Minimum, Maximum, Interval, etc. information will be replaced with the following string information palette.

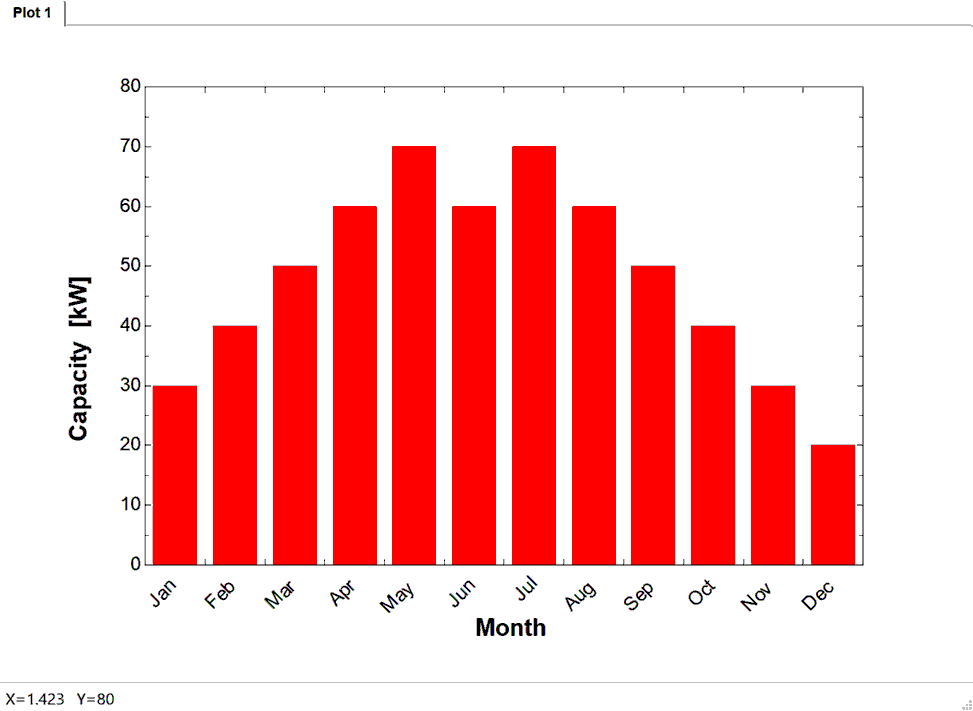
When a string variable is plotted, EES assigns the row number in the table to each string and plots the Y-axis variable variables versus the row number in the table. Then the numerical values that normally appear on the X-axis are suppressed and the strings are plotted in its place, as shown below. Strings can only be plotted on the lower and upper X-axes.

NOTE: Using string information in EES requires extra memory and slows execution. If the string information that you are using represents dates or time, it would be much better to set the column format in the table to Date, DateTime or Time. The resulting plot would look the same as if the strings were used for the date or time, but it will require far less memory. Date and DateTime formats are used in EXCEL and data can be read or copied in these fomrats.