
NewPlot (Macro Command)
NewPlot Name='NNNN' Table='TTTT' X=Xvar Y=Yvar Rows=1..10 LineStyle=1 Symbol=1 SymbolSize=6 Color=Red Legend='legend text' ErrorBars PointLabels ConnectLasttoFirst AutoUpdate XAxisLabel='new Xlabel' YAxisLabel='new Ylabel' XScale=log YScale=log XGridLines YGridLines
This macro command creates a new X-Y plot. The allowable keywords are shown above and described below.
Name='NNNN'
Set the name of the tab for this plot window to 'NNNN'. Note the plot tab name may be either a string constant within single quotes or a predefined EES string variable. If there is an existing plot with the same name, it will be overwritten.
Table='TTTT'
Data for the plot will be obtained from the Parametric table, Lookup table or Arrays Table that has the name 'TTTT'. The table name can be provided as a string variable, e.g., TN$. (If TTTT' is the name of both a Parametric table and a Lookup table, the data will be plotted from the Parametric table. The search order is Parametric table, Lookup table and then Arrays table.) Note that the table could also have been identified by entering PARN, LOOKN, or ARRN where N is the tab number of the Parametric, Lookup or Arrays table. You can also use ARR for the first Arrays table or INT for the Integral table.
X=Xvar Y=Yvar
Plot variable Xvar on the X-axis and Yvar on the Y-axis. Xvar and Yvar must appear in the specified table. When plotting variables from the Arrays table (ARR or ARRN) specify the array name as XXX[i], where XXX is the parent name of the array variable. In addition, the X-axis variable can be:
X=Index causes the index number of an Array to be used as the X-values.
X=Run_Number causes the run number of a Parametric Table to be used as the X-values.
X=Row_Number causes the row number of a Lookup table to be used as the X-values
The following keywords are optional.
Rows=
Data will be obtained from the specified rows in the table. If this keyword is not provided, all rows in the specified table will be used.
LineStyle=
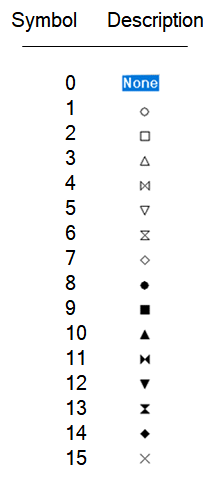
Symbol=
Bar= (use either Bar or Symbol, but not both}
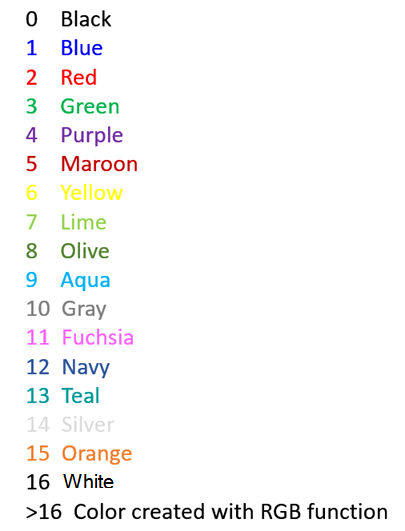
Color=
SymbolSize= (integer between 2 and 36)
BarWidth= (integer between 2 and 36) (use either SymbolSize or BarWidth, but not both}
The values provided for LineStyle, Bar, Symbol, and Color can be specified using integers or variables. The color can be provided as either an integer or the name of the color. The coding for these parameters is as follows:


Legend causes a legend item to be created. The legend text following the = sign can be a string constant of string variable that has been previously defined. If a string constant is used and it has embedded spaces, it it necessary to surround the text with single quote marks. If an equal sign is provided after the Legend keyword, it will be assumed that the legend text is the same as the name of the Y-axis variable.
ErrorBars will cause error bars to be drawn if the data that are plotted contain uncertainty information.
PointLabels keyword places a label next to each plotted point. By default, the label is an integer corresponding to the array position (when plotting from the Arrays window) or row (when plotting from the Parametric or Lookup tables). The point labels keyword can be optionally followed with a /ColName, where ColName is the name of a column in the table that is being plotted. In this case, the point labels will be set to the value (or string) in the specified column of the table rather than to the row or array position. The column number can be provided as an alternative to providing the column name. See Example 2.
ConnectLasttoFirst keyword will cause a line to be drawn from the last plotted point to the first point. This option is useful when plotting thermodynamic cycles.
AutoUpdate will cause the plot to be updated whenever the data in the table change.
XAxisLabel=
YXaxisLabel=
The X and Y axis labels are set by default to the name and units in the column header cell. These keywords override the default behavior so that the labels can be set as desired.
XScale=Log
YScale=Log
The X and Y scales are linear by default. These keywords change to log scales.
XGridLines
YGridLines
Grid lines are off by default. These keywords turn gridslines one for the X and Y axes.
All parameters except Name, Table, X, and Y are optional. Keyword LineStyle may also be provided as Line. A default value will be used if a parameter is not specified. Further modifications of the plot are possible with the ModifyPlot and ModifyAxis commands.
Example 1:
NewPlot Name='Plot 3' Table=PAR1 X=X Y=T Line=1 Symbol=1 Color=green XGridLines YGridLInes
Example 2:
An EES program has the following Parametric table.
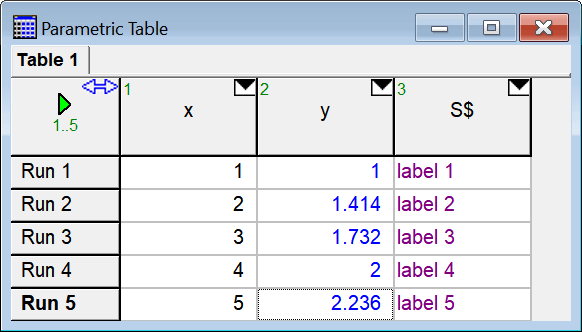
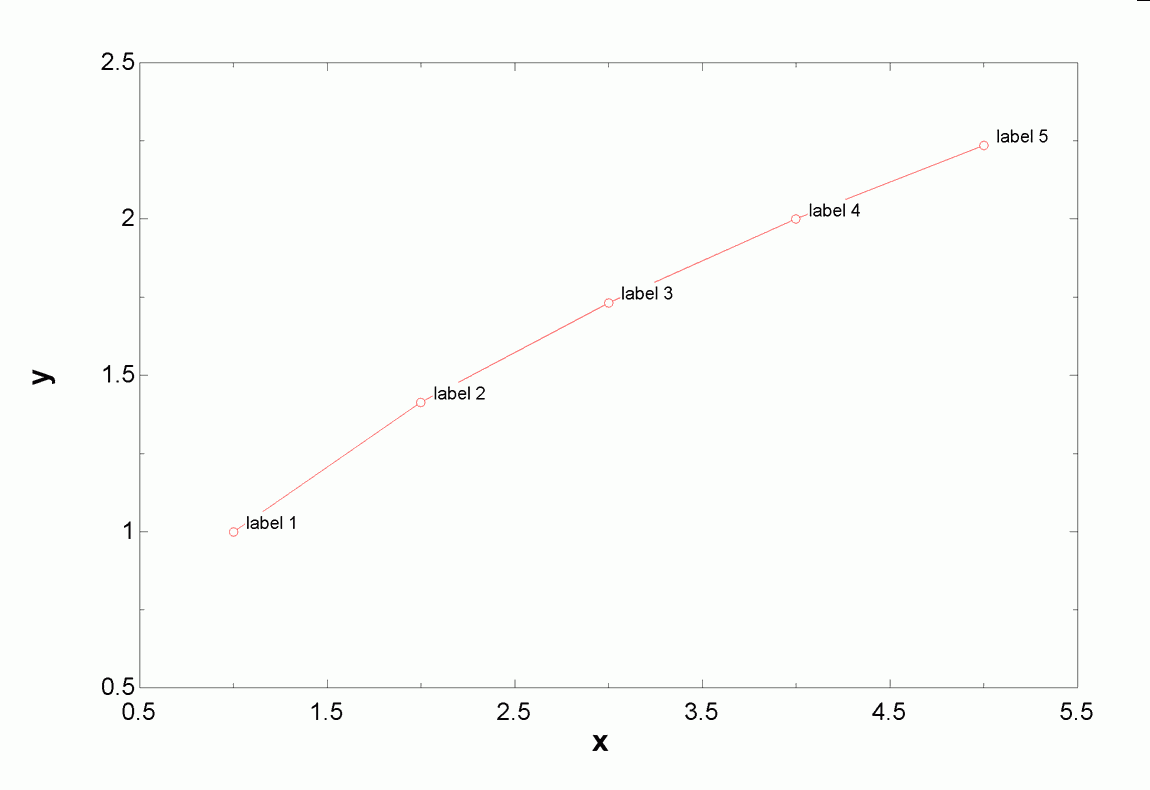
The following Macro commands (which can appear within a $RunMacroAfter ... $EndMacro clause) will place the labels in third column next to each point and override the autoscaling of the axes.
NewPlot Name='Plot Labels' Table='Table 1' X=X Y=Y LineStyle=1 Symbol=1 SymbolSize=6 Color=Red PointLabels/3
ModifyAxis X Name='Plot Labels' Min=0.5 Max=5.5 Int=1
ModifyAxis y Name='Plot Labels' Min=0.5 Max=2.5 Int=0.5
Example 3:
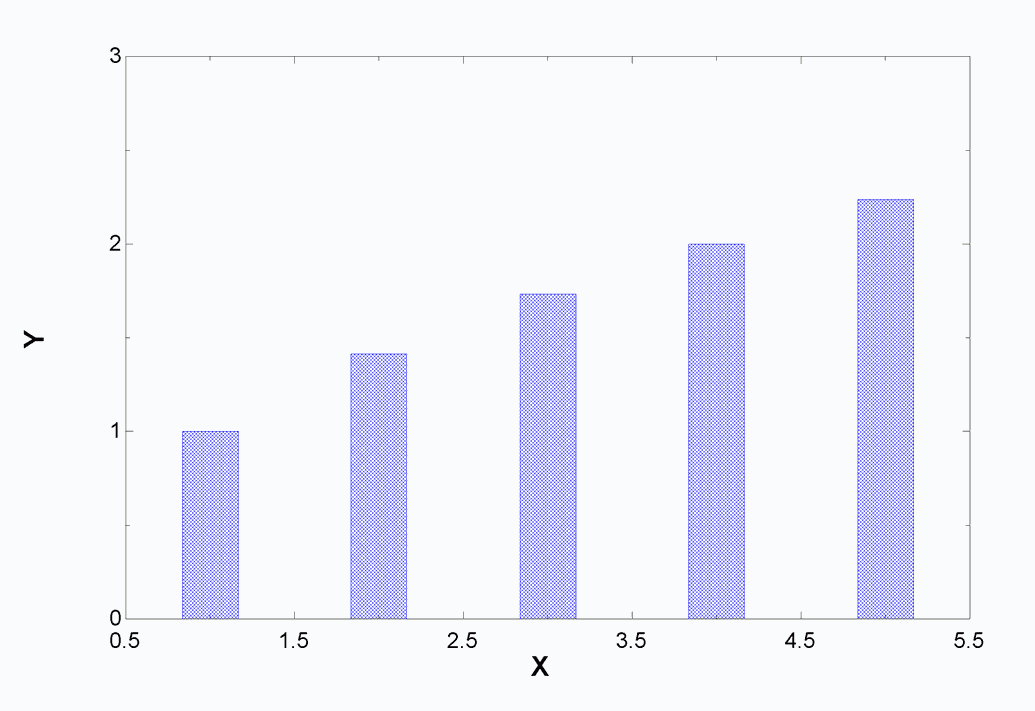
This example will produce a bar plot using the same table as in Example 2.
NewPlot Name='Plot Labels' Table='Lookup 1' X=X Y=Y Bar=2 Color=red
ModifyAxis X Name='Plot Labels' Min=0.5 Max=5.5 Int=1
ModifyAxis Y Name='Plot Labels' Min=0 Max=3 Int=1
ShowWindow Plot
See also: ModifyPlot