Contents
- Index
Adding Polylines, Bezier curves and Polygons
Polylines, Bezier curves and Polygons are graphic items that can be drawn on the Plot or Diagram windows. The general method for placing these graphic items is similar to that for drawing boxes or ellipses. This section provides specific information for drawing polylines and polygons. Note that the capability for drawing polylines, Bezier curves and polygons is only provided in the Professional license.
Polylines and Bezier Curves
Click the polyline button  on the toolbar. The cursor will be shown as a plus sign. Move the cursor to the location that will be the first point. The graphic item can be moved later, as described below, so clicking the exact position is not a concern. After clicking on the starting point, move the cursor to the second point. A line will be displayed from the last point to the cursor location. Click to position the second point. Continue this process until all of the segments of the polyline are drawn. Double-click (or press the Enter key) to end the drawing process. If you wish to abort the drawing process, press the Esc key.
Once the drawing process is completed, the polyline object can be dragged to a new location and the individual points composing the polyline can be moved. To drag the entire polyline to a new position, press and hold the mouse button down near the center of any one of the line segments. While holding the left mouse button down, slide the mouse to a new location. The polyline will move with the cursor. Individual points in the polyline can be moved in a similar manner. Press and hold the mouse down over any one of the vertices of the polyline until the cursor changes to up-down-left-right arrows. While holding the left mouse button down, move the cursor to a new location. The position of the selected vertex will move with the mouse.
The properties of the polyline can be changed when the toolbar is visible by either double-clicking the mouse while it positioned on a line or vertex. Alternatively, position the mouse on a line or vertex and right-click. Select Properties from the pop-up menu. The following dialog will appear for the Diagram windows. The locked and Name options are not available for the Plot windows.

The color and line type can be changed in this dialog. If the Smooth check box is selected, the polyline will be displayed with cubic Bezier curves using the endpoints and control points specified by the vertices. The first curve is drawn from the first point to the fourth point, using the second and third points as control points. Each subsequent curve in the sequence needs exactly three more points: the ending point of the previous curve is used as the starting point, the next two points in the sequence are control points, and the third is the ending point. Note that if the number of points in the polyline is not evenly divisible by 3, one or two points will not be represented in the Bezier curve. When the toolbar is visible, dotted lines will be drawn between the points to clearly indicate the position of the vertices, in case you wish to move them. These dotted lines will not be visible when the toolbar is hidden.
The Locked, Hide, and Name controls are visible when the polyline or polygon is drawn in a Diagram window. These controls operate in the same manner as for lines, arrows, boxes, and circles. Specifically, if Poly1 is provided as a name, EES will create the following variables:
Poly1.left Poly1.top
Poly1.LineColor Poly1.FillColor
Poly1.Hide Poly1.Transparent
Poly1.LineType Poly1.FillType
An array name can be provided. If the array name is Poly[1], EES will create the following variables to be consistent with the array name convention in EES:
Poly.left[1] Poly.top[1]
Poly.LineColor[1] Poly.FillColor[1]
Poly.Hide[1] Poly.Transparent[1]
Poly.LineType[1] Poly.FillType[1]
To hide or show a polygon or polyline named Poly[1], you could enter Poly.Hide[1]=True# or Poly.Hide[1]=False#. A simpler alternative that is accepted is to enter Poly[1].Hide or Poly[1].Show.
Additional points can be added to the polyline and a selected point can be moved deleted. To delete a point, move the mouse cursor over a point. It will be displayed as a filled box. Right-click on the point and a pop-up menu will appear. The following pop-up menu is applicable to the Diagram window. A very similar pop-up menu is displayed for the Plot windows.
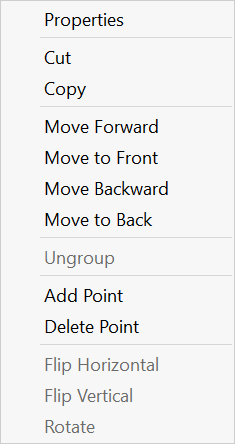
Select the Delete Point menu item. Follow the same procedure to add a point, but select the Add point menu item. The new point will be placed on the line connecting the selected point and the previous point. The new point can then be moved to a new location, if desired.
Polygons
Polygon graphic items are drawn by clicking on the polygon toolbar button  . The drawing process is identical to the process for drawing a polyline, except that the drawing process is concluded by clicking on the first point, which is marked with a circle. Alternatively, double-clicking the left mouse button or pressing the Enter key will cause the cursor to move from the last entered point to the first point to form an enclosed area and conclude the drawing process. The enclosed area will, by default, be shaded in lime color. The characteristics of the polygon can be changed by double-clicking anywhere within the enclosed area or by right clicking and selecting the Properties menu item from the pop-up menu. Either action will bring up the following dialog.

The line color, line type, fill color, and fill type can be specified. These attributes can be controlled with EES variables if a name is provided for the polygon, as indicated above. If the Transparent checkbox is selected, the graphic object will be display in a way that allows objects below it to be seen.
The values of the attributes can be copied to EES variables using the GetDiagramAttribute function.
The polygon can be moved to a different location by pressing and holding the mouse button down anywhere within the polygon and sliding the mouse to a new location. It can also be moved, after it is selected, using the arrow keys. The first press of an arrow key will move the item 5 pixels. Subsequent presses of the arrow key (within 3 seconds) will move the polygon 1 pixel in the indicated direction. Individual points can be moved by moving the cursor over the selected point and pressing the mouse button. Hold the mouse button down while moving the cursor to move the point to a new location. Right click on a point to bring up a pop-up menu that allows points to be added or deleted.
Note that versions before version 8.765 cannot read files containing polylines or polygons.