
Add Table in Diagram Window
One or more tables can be placed in the Diagram window containing text and/or the values of EES variables that have been determined in the calculations. Clicking the Add Table button at the lower right of the Diagram Tool Bar will result in the following dialog
Enter the number of rows and columns. The column width and the alignment of text in the table cells can also be entered.
The column width is entered in pixels. The value provided as a default provides a width of approximately 1 inch. The width will be scaled if the EES program is opened on a system having a monitor of a different resolution. The width of individual columns can be adjusted if needed in the Diagram window while in Development mode by positioning the mouse directly on a vertical grid line and holding the left mouse button down with moving the mouse left or right.
The alignment may be Left, Center or Right. Alignment of individual cells may be changed within the Diagram window while in Development mode by right-clicking the mouse in the cell and selecting Align from the popup menu.

The table will be displayed in the Diagram window within a red border when it is selected. The table can be moved to a different location while in Development mode by pressing and holding the left mouse button anywhere in the region that is inside of the red border, but outside of the table border, e.g.,

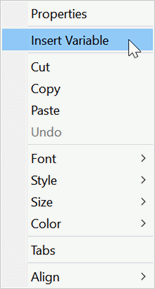
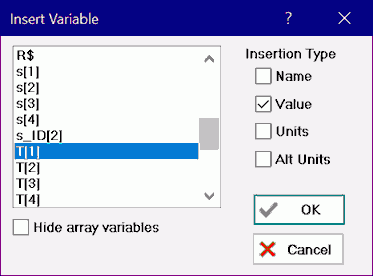
The cells in the table can only be edited while in Development mode. Click in a cell and enter the desired text. The arrow keys can be used to move to an adjoining cells. An important capability of tables is that the values of EES variables can be placed in the cells. To do this, right-click the mouse in the cell and selected Insert Variable from the popup menu. This will bring up the Insert Variable dialog where you can select the EES variable that will be placed in the cell.
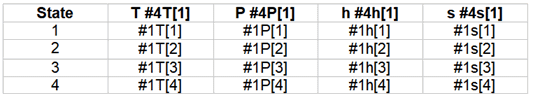
The figures below provides an example of a table in which the cell have been filled with EES variables. In Development mode, the table will appear as
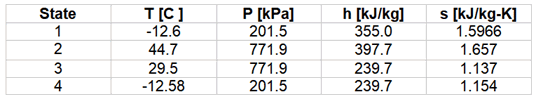
When the Diagram window is in Application mode (tool bar hidden) the variable codes will be replaced with the values of the variables.
The characteristics of the text in individual cells in the table, such as font, font style, color etc., can also be changed by selecting the text, right-clicking in the cell and selecting the formatting option from the popup menu. The selection may be applied to one or more rows of text. However, it is not possible to select a column. Instead, each cell in the column must be changed.
See also: