
Linear Regression
This command provides regression capability for the data in the Parametric, Lookup, Arrays, and Integral tables. Note that the Curve Fit command in the Plot menu also provides regression capability but only for one independent variable. With the Linear Regression command, the data in any column can be regressed as a function of the data in up to 15 other columns, i.e., there may be up to 15 independent variables. A maximum of 100 coefficients may be determined in the linear regression.
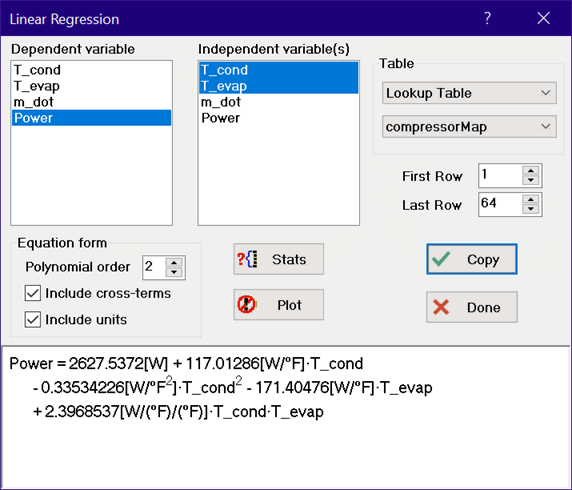
First select the table you wish to operate on from the drop-down controls at the upper right and the starting and stopping rows in that table. Specify the dependent variable by clicking on the variable name in the list on the left. The independent variable(s) are selected by clicking on the names in the list on the right. To deselect an item, click it a second time. For example, suppose you have a Lookup Table with three columns having titles A, B, and C. To determine a correlation representing A as some function of B and C, select A from the list on the left, and B and C from the list on the right.
The dependent variable will be represented as a linear polynomial function of the independent variables. The order of the polynomial is set by clicking on the 'spin button' up or down arrows. The polynomial order may be 0 to 6. If the cross-terms box is selected then terms involving the product of the independent variables will be included in the correlation. As any information relating to the equation form is entered, a representation of the equation to be fit is displayed in the box at the bottom. The cross-terms box is disabled if there are more than 5 independent variables and a polynomial order higher than 2.
You may wish to exclude some terms from the regression. This is done simply by clicking on the term. This action will enable the Exclude button. Click the Exclude button to remove the term from further consideration. It is displayed within a crossed-out red box. If you wish to later include an excluded term, click on it. The Exclude button should now be titled Include. Click the Include button.
Click the Fit button. The fitted equation will appear in the display box.
The Stats button will be enabled after the fit is completed. Clicking the Stats button will provide a table listing all of the coefficients, their associated standard errors, and other statistics such as the root-mean-square (rms) error, the bias error, and the R^2 value. The Exclude button will now become the Plot button. Clicking the Plot button will display a plot of the predicted values of the dependent variable versus the values in the table. The coefficients can be copied to the Clipboard by checking the Copy to clipboard control The Fit button will now be titled Copy and the Cancel button will be titled Done. Either button will dismiss the dialog window. The Copy button will first copy the fitted equation to the clipboard. You can then paste this equation into an EES worksheet. Note, however, that the Copy process will overwrite any other information in the Clipboard, such as the coefficients copied from the Regression Statistics dialog window.
If the dependent and/or Independent have units, the coefficients determined in the fitting process also have associated units. The units will be determined and displayed in the equation if the Include Units check box is checked. Uncheck this control if you do not want to have the units included with the equation. In this case, EES may display a units warning message if the equation is used in the Equations window unless the equation is surrounded with $CheckUnits On/Off directives.
See also: