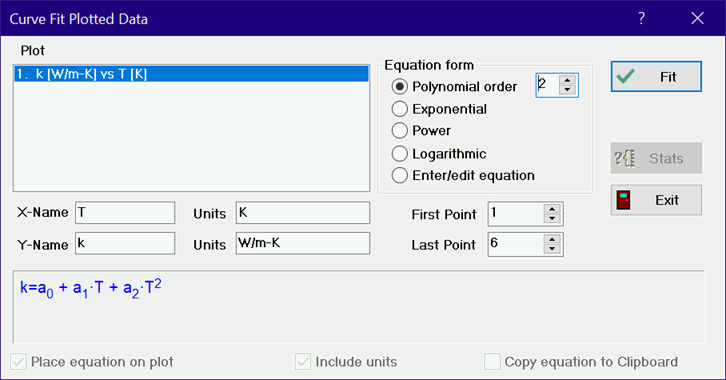
Curve Fit
The Curve Fit command will find the best fit of a smooth curve through a previously plotted set of data points using unweighted least squares. Chose the data to be fitted from the list of plots at the left. Note that data can be plotted from the Parametric, Lookup, Arrays, or Integral table with the New Plot or Overlay Plot commands. The names and units used in the plot will be displayed. You can edit the information in the variable names and units if you wish. The first and last point will be displayed for the selected plot. You can change these values if you wish to curve fit a subset of the data.
Select the form of the curve fit by clicking the appropriate radio button. A sample of the equation form will appear in blue in the box at the bottom of the dialog window. The first four buttons correspond to commonly used equation forms for which linear least squares can be used to determine the unknown coefficients. The Enter/Edit Equation button allows you to enter any equation form or to edit a previously entered equation. The equation you enter may be linear or nonlinear in the unknown parameters. You will have to supply guess values and (optionally) bounds for the unknown parameters.
Click the Fit button (or press the Enter key). The fitted equation will be displayed in red in the box at the bottom of the dialog window.
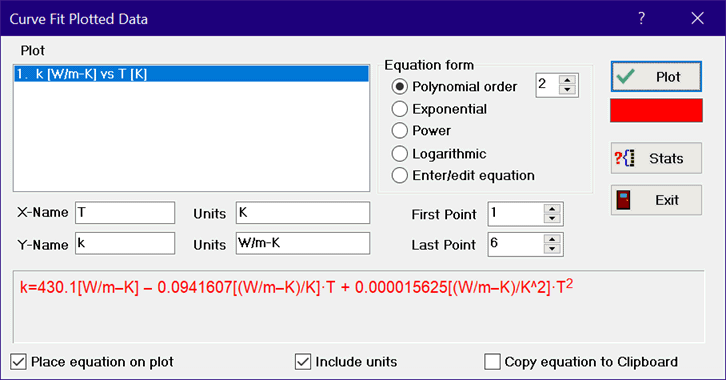
The Fit button will now have changed into the Plot button and the default plot line color will appear below the button. Click in the plot line color box under the Plot button to change the color of the line that will be plotted using the curve fit equation when the Plot button is clicked.
Note that if the plotted variables have units, the coefficients in the curve fit will also have units, which are included with their values. If the curve fit is copied into Equations window with the units information, EES will not display unit warnings. If you do not want to have the units included in the curve fit equation, clear the Units edit boxes for both the X and Y variables before clicking the Fit button or uncheck the Include units checkbox. Note that units for the coefficients are not determined for the Enter/Edit equation option.
A Stats button will appear. Click the Stats button if you wish to see statistical information relating to the curve fit, such as the standard error of the parameters and the root mean square error of the fit. Click the Plot button to overlay the curve fit equation on your plot. If the Place equation on plot check box is checked, a legend containing the equation will be created and displayed on the plot. The curve fit equation will be copied to the Clipboard if the Copy Equation to Clipboard check box is selected when either the Plot or Exit button is selected.
The curve fit command will regress any plotted variable as a linear or non-linear function of any other single variable. The Linear Regression command in the Tables menu provides linear regression capability for one to 15 independent variables.
See also: Curvefit1D