3-D Plot Controls for 3-D Surface and 3-D Polygon Plots
The 3-D plot control panel can be made visible or hidden by double-clicking or right-clicking the mouse in the plot window. The Show/Hide Toolbar command in the Plot menu also provides this function.
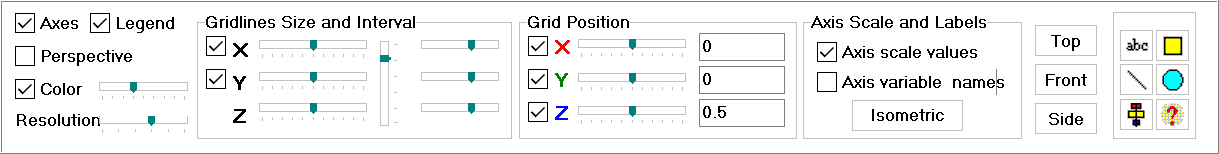
The control panel for 3-D surface plots is shown below.
The Axes checkbox has 3 positions. Clicking in the box rotates through the positions. If the box is checked, X, Y, and Z axis lines are drawn through the plot origin with red, green, and blue dotted lines, respectively. If the box is checked with a white background, axis labels will be displayed to help identify the rotational position. If the box is unchecked, the axis lines are not drawn.
The Legend checkbox controls the visibility of legend that shows the relation between the color of the surface plot and the value it is associated with.
If the Perspective checkbox is checked, a perspective projection of the 3-D surface is displayed. If the box is not checked, orthogonal projection is employed. Perspective projection appears more correct to the eye but orthogonal projection is easier interpret.
The Color checkbox has three positions. If the box is unchecked, the surface is displayed with grayscale colors. The color can be controlled with the slider to the right of the color checkbox. If the box is checked, the value of Z (or the value of an optional color variable) is represented on the surface in colors that range from red to blue (check with gray background) or a full spectrum colors (check with white background) . The optional color variable is chosen in the X-Y-Z Plot Setup. If a variable is not chosen, the color variable is Z itself.
The Resolution slider controls the size of the polygons used to form the surface plot. High resolution (slider bar to the right) results in a crisp plot, but rendering and rotating may be sluggish. You may want to experiment with this control to determine a suitable compromise between display speed and quality.
Gridlines Size and Interval
Slider controls are provided to separately control the size of the X, Y and Z axes. Moving the slider with the mouse to the right increases the size for the selected axis. The check boxes for X and Y control the visibility of surface grid lines. The vertical slider scales the X, Y, and Z directions uniformly. This capability, which controls the size of the plot, can also be controlled with the mouse scroll wheel. The lower and upper limits of the plotting range for surface plots can be changed for the X and Y axes by right-clicking on the slider control. Moving the slider down increases the size of the plot in the window. This slider can also be controlled with the up/down arrow or PageUp/PageDown keys. The second set of horizontal slider in this group control the number of grid lines. Moving the slider to the right increase the number of grid lines to a maximum of 20.
Grid Position
The option of displaying grids in each of the orthogonal planes is controlled with the checkboxes. For example, the grid in the YZ plane will be visible if the checkbox preceding X is checked. The grid can be moved to any position within the range of values chosen in the X-Y-Z Plot Setup using the mouse or the up/down arrow or PageUp/PageDown keys. The current location of the grid is shown in the box to the right of the slider. A value can be directly entered into this box which will cause the grid to move to the specified value.
Axis Scale and Labels
If the Axis scale values check box is checked, the lower and upper limits of the scales for the X, Y, and Z axes will be displayed.
The Axis variable names check box has 3 positions. If unchecked, no axis labels are provided. If checked, the axes are identified with 'X', 'Y', and 'Z'. If grayed, the names of the variables plotted on the X, Y and Z axes will be displayed.
Clicking the Isometric button will orient the axes in an isometric manner that best shows the axis scale values and axis names.
Top, Front, Side
Clicking these buttons will rotate the display. If the Axis Orientation is set in XY-Z mode (see below), clicking the Top button will shows the X-Y plane looking down the positive Z-axis towards the origin. The Front button presents a Y-Z plane viewed along the positive X axis. The Side button displays the X-Z plane from the positive Y axis. I
Tool Bar
The tool bar provide buttons to place text, lines, boxes, and circles on the plot in the same manner as for X-Y plot windows. An align button is also provided. The help button displays this page.
Position Indication
Holding the Shift and Ctrl keys down will cause the 3-D coordinates to be displayed in the window caption, provided that the X and Y-axis grids are visible. The information displayed is the current locations of the X and Y grids, followed by the value of Z on the surface for the given X and Y. If the color corresponds to a variable other than Z, its value on the surface at the specified X and Y is also shown. If the X and Y grids are moved using the mouse while the Shift and Ctrl keys are held down, the information in the window caption will be automatically updated.
The control panel for 3-D points plots is shown below.
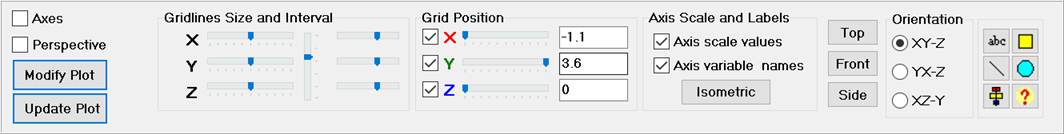
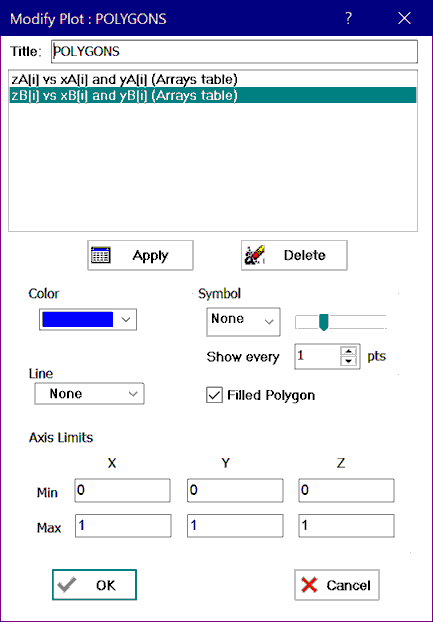
The Color and Resolution controls are replaced with the Modify Plot and Update Plot buttons. The Modify Plot button allows the properties (such as color, line type, symbol, polygon fill, and axis scale limits) of the overlayed plots to be adjusted, as shown.
The Update Plot button replots the data. This is useful if any of the data used to construct the plot have changed.
The control panel also provides a orientation radio group. The default position is XY-Z in which the floor of the plot in the Isometric view shows the X and Y axes and Z is pointed up. YX-Z exchanges the positions of the X and Y axes. XZ-Y displays X and Z axes on the floor of the plot with the Y axis pointed up.
Return to X-Y-Z Plot