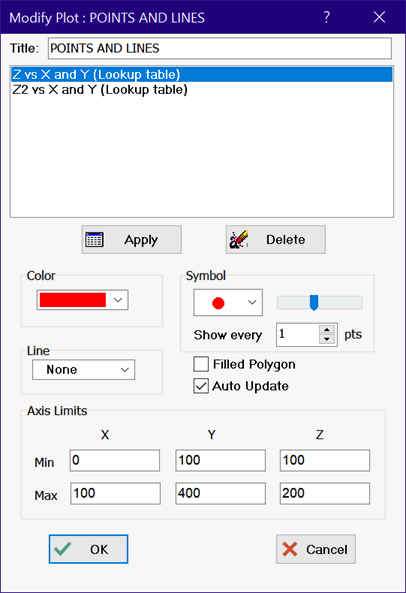
Modify Plot3D (for 3d vector, 3D point and polygon plots)
Modify Plot3D is available for 3D point and polygon plots. It is not available for surface plots. To access the Modify Plot3D dialog, click the Modify Plot button at the bottom of the plot window. If these controls are not visible, click the right-mouse button anywhere in the plot window.
Selecting a Plot
The plots lines appearing in this plot window are shown in the list box at the top of the dialog. The last plot line in the list is preselected as you enter this dialog window. Select the plot line for which changes are to be made. The line type, color, symbol, symbol size and other plotting parameters will be displayed for the selected line.
Plot Symbols
A spherical plot symbol may be displayed at selected points.The size of the plot symbol is controlled with a slider control in the Symbol group, seen in the figure at the top of this page. Placing a symbol at each point can result in a messy plot when the line has many points. The Show every control is provided to specify symbols be drawn every N points where 1<N<# of points.
Filled Polygon
Click this check box if you want the plot to display a polygon with vertices defined by the points that have been plotted.
Automatic Update
When the Automatic Update control is selected, the plot will use the current data in the table from which the plot was developed, rather than the data that existed in the table when the plot was first drawn. The data can be plotted from the Parametric, Lookup, Arrays, or Integral tables. Any change in the data will cause the plot to be redrawn before it is displayed.
Axis Limits
The scale for the X, Y and Z axes is controlled by the values in the Axis Limits group.
See Also: X-Y-Z plot