AddPlotText (Macro Command)
AddPlotText NAME='PlotTabName' X=Xpos Y=Ypos TEXT='PlotText' or VARIABLE=abc SIZE=16 STYLE=Plain COLOR=Red LEGEND=1 ORIENTATION=0 OPAQUE=Yes
Create a text item on an X-Y or X-Y-Z plot window. The keywords to the left of the = signs can be provided in any order. All keywords except NAME and TEXT are optional.
NAME=
The text following the = sign an be a string constant (surrounded with single quotes) or a string variable that has been previously defined. The text must be the name that appears on one of the plot tabs. Alternatively, a numerical value can be provided to indicate the plot by its plot tab number. The first plot is number 1.
X=, Y=
The values that follow these keywords determine the starting point of the text. The values may be provided with numerical constants or predefined EES variables. Values of 0, 0 correspond to the lower left corner of the plot rectangle. Values of 1, 1 correspond to the upper right corner of the plot rectangle. Note that the PlotCoord function can be used to return the relative position (0 to 1) of a specified value on the X or Y axis.
TEXT=
The string constant or string variable following this keyword is the text that will appear on the plot. {Note: do not use TEXT= if VARIABLE= is provided}
VARIABLE=
An existing EES variable in the main section of the Equation window is expected after the = sign. The value of the variable will be displayed on the plot with its variable name and units. If you do not want the variable name to be displayed, add -N after the variable name (separated by a space). If you do not want the units to be displayed, add -U after the variable name. If you do not want the value of the variable to auto update, add -A after the variable name. For example: VARIABLE=xyz -N -U -A
SIZE=
The font size of the text follows this keyword. It can be supplied as a numerical constant or as an EES variable. The default value is 16
STYLE=
The font style must be PLAIN, BOLD, or ITALIC The default is PLAIN
COLOR=
The color name can be supplied as a string constant or string variable. The colors names are identified in the NewPlot macro. The default is black
LEGEND=1
The number following this optional keyword refers to the order of the plot in the plot window. The first plot is 1. If this keyword is provided, the plot text is associated with a symbol that identifies the plot line.
ORIENTATION=
The number or value of an EES variable that follows this keyword is the angle (in degrees) of the text. The default is 0 (for horizontal). Vertical text has a value of 90.
OPAQUE=
A YES or NO follows this optional keyword to indicate whether or not text should be positioned within a rectangle with a white opaque background.
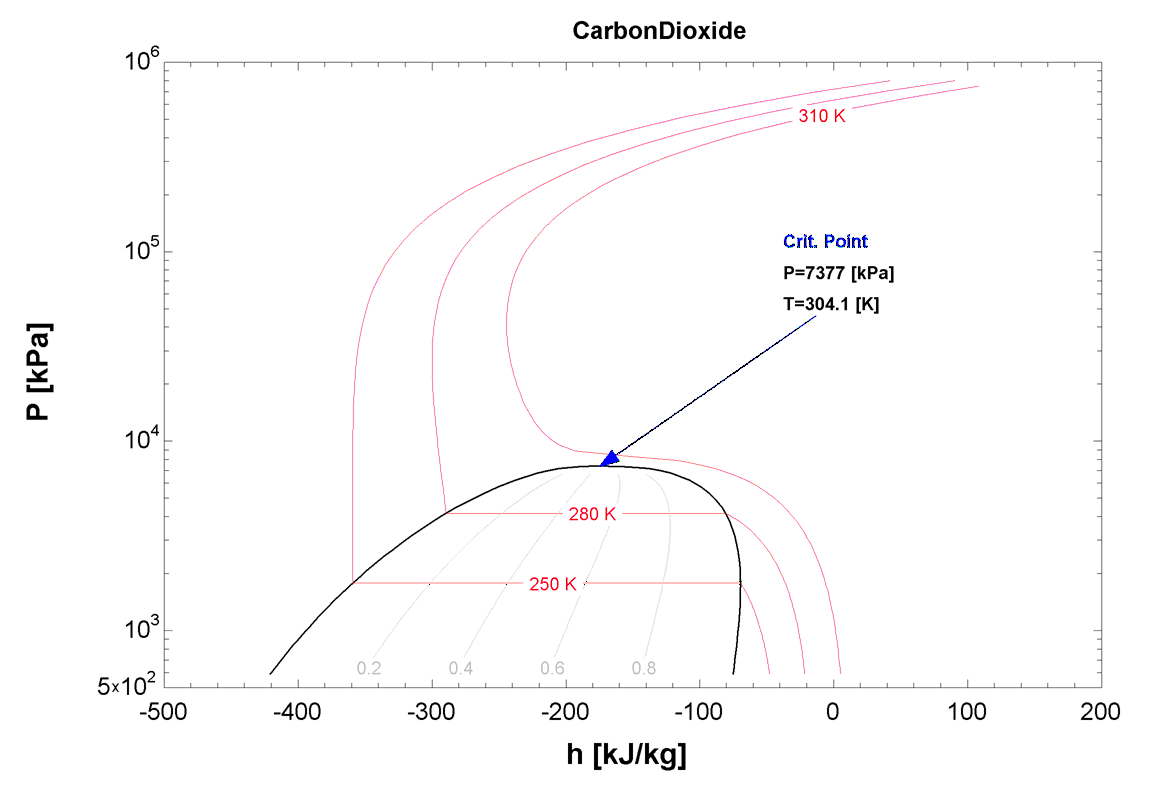
Example:
$UnitSystem SI K
$RunMacroAfter
VarInfo P units='kPa'
VarInfo T units='K'
DeletePlot 1
F$='CarbonDioxide'
PropPlot F$ PH 3 310 280 250 0 DoQLines
P=P_crit(F$)
T=T_crit(F$)
h=enthalpy(F$,P=P,x=1)
P$=PlotTabName$(0)
XPos=PlotCoord(P$, 'X', h)
YPos=PlotCoord(P$, 'Y', P)
AddPlotLine P$ X1=0.70 Y1=0.60 X2=Xpos Y2=YPos Text='C' Color=Blue LineType=Solid ArrowType=1 ArrowSize=4
AddPlotText P$ X=0.66 Y=0.70 Text='Crit. Point' Color=Blue Style=Bold Size=18
AddPlotText P$ X=0.66 Y=0.65 Variable=P Color=Black Style=Bold Size=18
AddPlotText P$ X=0.66 Y=0.60 Variable=T Color=Black Style=Bold Size=18
$endMacro

See also: OverlayPlot