$PropertyPlot
The $PropertyPlot directive has the following general format:
For real or ideal gas fluids:
$PropertyPlot FluidName PlotType N1 P1 P2 .. P_N1 N2 Q1 Q2 .. Q_N2 DoQLines TMin=Tmin TMax=Tmax PMin=Pmin PMax=Pmax P=Patm Color1=ColorID Color2=ColorID Name='myplot'
For incompressible substances:
$PropertyPlot FluidName FunctionName Color1=ColorID Name='myplot'
where
FluidName is any ideal gas or real gas property name. Append /EESREFPROP or _RP if the property values are to be obtained from the EES_REFPROP interface.
PlotType is anyone of the following: TS, TV, TH, TRho, PV, PH, HS, TP, or PSY. (PSY is only applicable to AIRH2O; HS is not available for EES_REFPROP fluids.}
Note: All following keywords are optional. Default values will be supplied if these specifications are not provided. However, if N1 is provided and set to anything other than DEF, then N1 values of the constant property in group 1 (P_1..P_N1)must be provided. If N2 is provided and set to anything other than DEF, then N2 values of the constant property in group 2 (Q_1..Q_N2) must be provided. If N1, P1..P_N1. N2, Q_1..Q_N2 are provided, they must appear before the other keywords. Otherwise the order in which the keywords are provided does not matter.
N1 is the number (<=6) of constant property lines in the first group of properties. The first group is for constant pressure for TS, TH, TV and TRho and constant temperature for PV and PH. For PSY it is the number of wet bulb lines.
NOTE: if N1 is set to 'DEF', the default number of constant property lines for the first group of properties and their values will be provided. Enter 0 to suppress the lines.. If N1 is not provided, it is set to 'DEF'. (Not used for incompressible substances.)
P1..P_N1 are the N1 values of the constant property in group 1
NOTE: Property values are provided in the specified EES unit system. See the $ConvertEESREFROPUnits directive for EES_REFPROP fluids. If N1 is DEF, do not provide any values. (Not used for incompressible substances.)
N2 is the number (<=6) of constant property lines in the second group of properties, which is usually specific entropy except for the TS and PSY plots for which it is specific volume. (N2 should be 0 for EES_REFPROP fluids)
NOTE: if N2 is set to 'DEF', the default number of constant property lines for the second group of properties and their values will be provided. If N1 is not provided, it is set to 'DEF' )
Q1..Q_N2 are the N2 values of the constant property in group 2 (Not used for incompressible substances.)
DoQLines will draw lines of constant quality on the plot. (Not used for incompressible substances.)
TMin and TMax are the minimum and maximum values of temperature for TS, TV, TH, TRho and PSY plots.
PMin and PMax are the minimum and maximum values of pressure for PV and PH plots.
P is only understood for PSY plots to set the atmospheric pressure. By default, the psychrometric chart is constructed for standard barometric pressure 101.3 kPa.
Name is the name that appears on the tab in the plot window. If Name is provided, it will replace the default value.
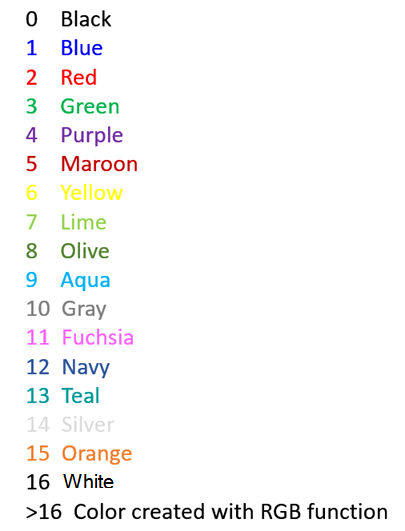
Color1 is the color used for the group 1 constant property lines. ColorID is either an integer between 0 and 16 or a color name as indicated in the following table.
Color2 is the color used for the group 2 constant property lines. ColorID is either an integer between 0 and 16 or a color name as indicated in the following table. (Not used for incompressible substances.)
Additional plots can be superimposed on the property plot using the $OverlayPlot directive.
NOTE: The $NewPlot provides an alternative to using the PropPlot macro command. Macro commands provide additional plotting options. This directive can only be used with a Professional license.
The examples below assume that the unit system has been set with $UnitSystem directive or with the Units macro command as follows:
Units SI C kPa kJ Mass
Example 1
{Create a PH property plot for Ammonia with the default values.}
$PropertyPlot Ammonia PH
Example 2
{Create a TS property plot for Steam. Include 5 specified constant pressure lines (in red) and the default constant entropy lines (in blue) and draw lines of constant quality. Note that the values for the constant pressure lines can be set with previously defined variables as well as with numerical values.}
$PropertyPlot Steam TS 5 11000 5300 2100 660 299 DEF DoQLines TMax=600 Color1=Red Color2=Blue Name='Steam Plot 1'
Example 3
{Create a Psychrometric chart with wetbulb lines of 10, 15, 20, 35, 30, 35 C and specific volume lines of 0.8, 0.85, 0.90, and 0.95 m3/kg at a total pressure of 101 kPa. The P=101.3 and Mollier, TMin and TMax are optional. Note that these values can be specified using previously defined variables.}
$PropertyPlot AirH2O PSY 6 10 15 20 25 30 35 4 0.8 0.85 0.9 0.95 P=101.3 TMin=5 TMax=45
Example 4
{Create a plot of density versus temperature for Diesel#2 using data from the incompressible substance library.}
$PropertyPlot Diesel#2 density Color1=blue
See also: $NewPlot