Histogram Plot
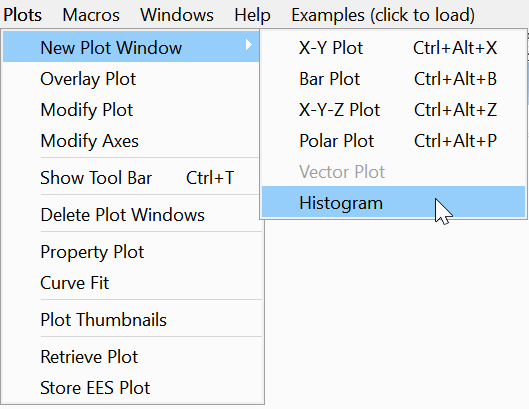
A histogram is created by selecting Histogram from the New Plot Window command in the Plots menu, as shown.
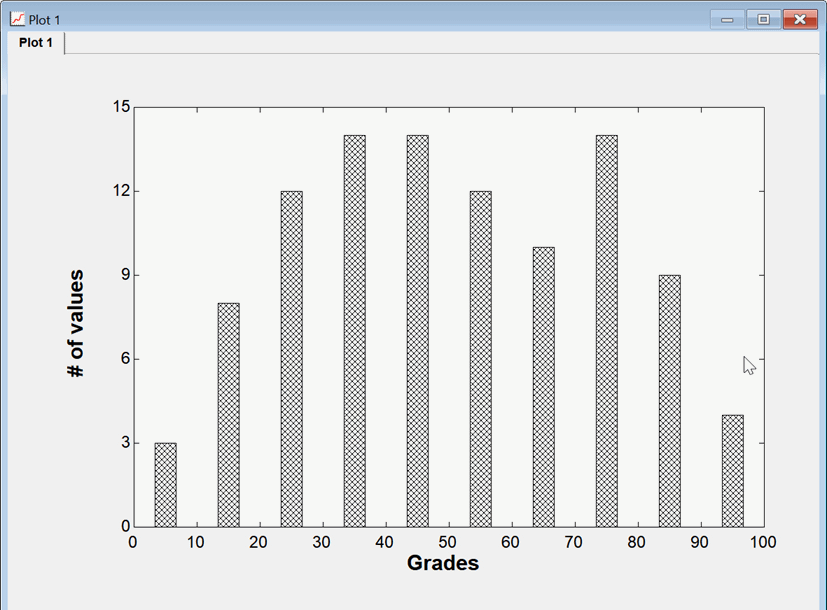
A histogram provides a bar chart showing the number of occurrences of values within specified intervals. For example, consider a column of values in a table that range from 0 to 100. The histogram plot can create bars indicating the number of values between 0 and 10, 10 and 20, and so on. A histogram can be created from any EES table. Only one column of values is required. String values cannot be used.
The Histogram plot set up dialog operates after selecting Histogram.
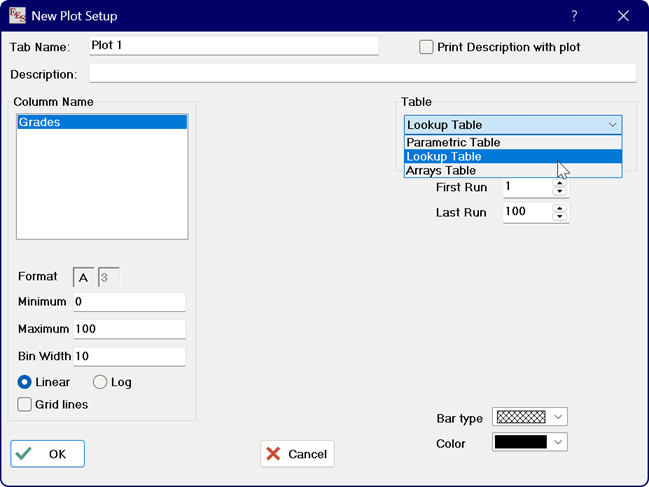
Select the table that contains the column that is to be used for the histogram. Then select the column. The Minimum, Maximum and Bin Width fields will be automatically populated but they can be changed as needed. These values must result in a number of bins between 2 and 20. Select the bar type and color and click the OK button.
Changes to the plot can be made in the Modify Plot dialog. Right-click within the plot rectangle or selecte Modifiy Plot from thje Plots menu.
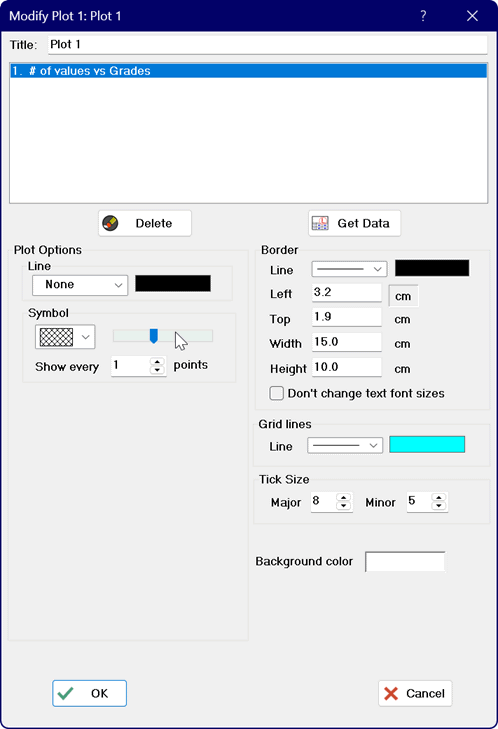
The width of the bars is initially set to a default value, but it can be changed in the Modify Plot dialog by moving the slider bar in the Symbol group box. The fill and color of the histogram bars can also be changed,
See also: Bar Plot