Modify Axis
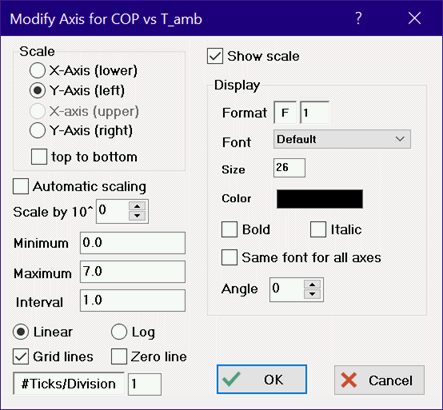
Modify Axis allows the appearance of the selected axis of an existing plot to be changed. This command can also be invoked by right-clicking or double-clicking the mouse in the Plot window on the axis scale for which changes are to be made. For a polar plot, right-click just outside of the plot circle. The axis for which changes are to be made is selected with the radio button controls at the upper left. The current settings for the selected axis will be shown. The plot will be automatically redrawn to reflect any change in these settings after the dialog window is dismissed.
The Modify Axis dialog shown above is for an X-Y plot. The dialog will have a different controls for X-Y-Z, Bar, and Polar plots.
By default automatic axis scaling is off and the scaling of the selected axis is controlled by the minimum, maximum and interval values shown in the edit boxes. These values can be changed as desired. In the Professional license, the minimum, maximum and interval can be supplied as EES variables by entering the EES variable name in the edit box in place of the number.
If the 'Automatic scaling' checkbox is checked then the axes will be automatically scaled as appropriate to contain plotted data for all lines in this plot window. In this case, the edit boxes for the minimum, maximum and interval values will be disabled. If a new plot line is added or if the data in one or more of the plots are changed such that one or more points are outside the range of the axis scale, the axis scale will automatically change. Automatic scaling is disabled if the minimum, maximum or interval is provided as an EES variable.
There is an option to scale the axis by a powers of 10. If the scale is set to 10^2, the values displayed on the plot axis will be divided by 10^2 and x 10^2 will appear with the values on the plot axis. By default, the scale is 10^0 or 1 and the scale factor is not displayed.
The #Ticks/Division provides control of the number of minor tick marks. If the Grid lines checkbox is checked, the # Ticks/Division control will be shown within a border. Clicking anywhere within this border will cause the display to change to # Grids/Division. This control will allow the axis to be displayed with either tick marks or grid lines between the main divisions displayed at the location of each axis number.
If the 'Same font for all axes' checkbox is selected, the font size, color, name and style will be applied to all axes for this plot.
The angle at which the numerical values on the axis are displayed can be set in the Professional license. The angle can be set to values between -90 and +90 degrees. Positive values of the angle cause the text to be drawn with a southwest-northeast slope. Negative values result in text with a northwest-southeast slope. The default, 0, is horizontal text.
Note that EES allows a second Y-axis on the right side of the plot and a second X-axis on the top of the plot for X-Y. These axes can be moved by pressing the Ctrl key and the up/down (for the X-axis) and left/right (for the Y-axis) arrow keys.
EES allows data to be imported from EXCEL in Date or DateTime format. Data in these formats can be plotted showing the date and/or time.