Polar Plot
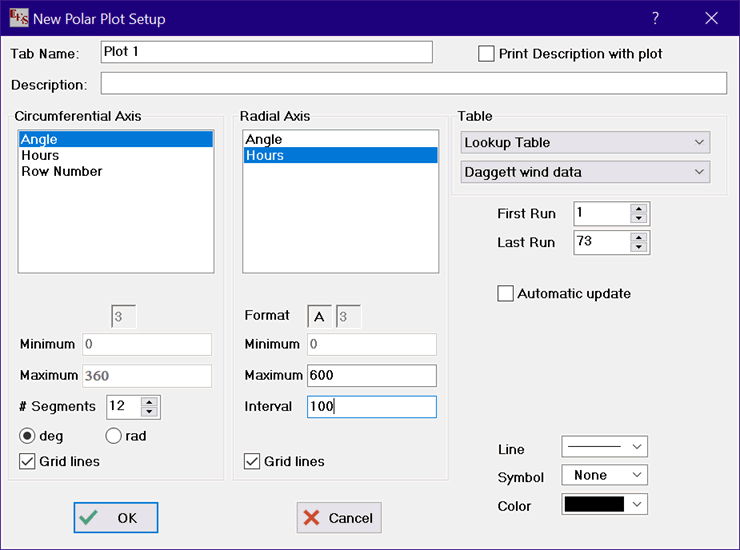
The New Plot Window | Polar Plot command allows variables defined in the Parametric Table, the Lookup Table, the Arrays Table or the Integral Table to be plotted as a function of any other variable in the table using a polar plot format. The plot is drawn in a new tabbed plot window. The information needed to produce the plot is specified in the New Polar Plot Setup dialog, shown below. All of the information specified in this dialog window can be modified later using the Modify Axes and Modify Plot commands.
The Tab Name is the name that will appear on the tab of the Plot Window. The name you enter can be up to 80 characters in length, but shorter tab names are preferable. The Description edit field can be used to enter a description of the plot contents or any other information you wish to save. The description can be up to 255 characters in length. It is saved with the Plot window. The description will be printed when the plot is printed if the check box at the upper right of the dialog is checked. The description and printing option can be later modified by right-clicking on the tab for this plot in the Plot Window.
Select the table that is to be plotted with the controls in the upper right of the dialog window. The runs (or rows) for which values will be plotted is indicated in the input boxes at the upper right just below the table lists. The variables to be plotted on the Circumferential and Radial axes are selected from the lists by clicking on their names, using the scroll bar or up/down arrow keys, if necessary to bring the variable names into view. Only one radial axis variable can be selected. Use the Overlay Plot command to place additional polar plot lines on an existing polar plot.
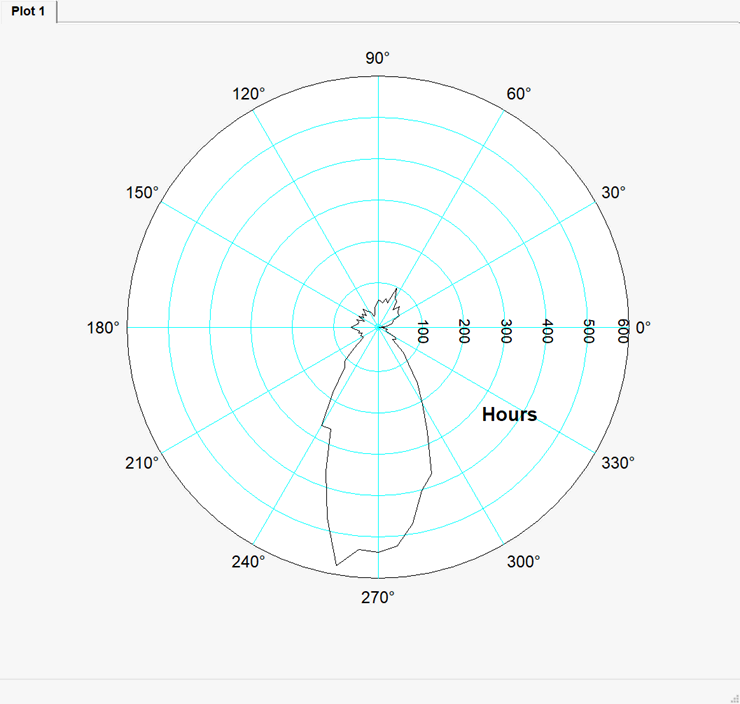
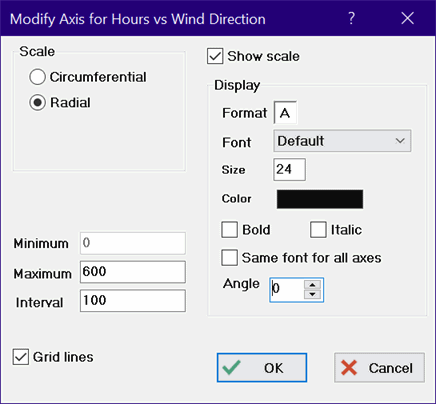
The diameter of the polar plot is initially set to the Plot Width specified in the Plot tab of the Preferences dialog. Other default plot properties are also specified in the Preferences dialog. The diameter and other plot properties can be changed with the Modify Plot command. The Modify Plot can be accessed from the Plots menu or more simply by right-clicking anywhere within the polar plot circle. Also, the Radial axis labels are shown with vertical text along a horizontal radius, as shown below. The position of the Radial axis numbers and label can be controlled by changing the value of Angle at the right side of the Modify Axis dialog when the Radial axis is selected. Values between 0 and 90 are allowed. 90 will result in horizontal numbers that start from the center and move to the top of the polar plot.
The Circumferential axis can be selected to be in degrees (0 to 360) or in radians (0 to 2 pi). The Modify Axes command in the Plot menu allows the Circumferential axis to be configured in a counter-clockwise (default) or clockwise direction and also allows the 0 point to be placed at the right (default) or the top of the plot window. The Modify Axis command can be accessed from the Plots menu or by right-clicking just outside of the polar plot circle.
The format for the display of the Radial axis is controlled by the two fields to the right of the word Format control the format of the numbers appearing in the scale for the Radial axis. The first field can be an A, E or F. F and E format the numbers on the scale with a fixed number of decimal places or exponential notation, respectively. The number of decimal places (for fixed or exponential notation) is entered in the second field as a single digit number between 0 and 9. A (for automatic) chooses the E or F option format and the number of digits automatically to produce an appropriate presentation of results. The Maximum and Interval fields control the scaling for the Radial axis; the minimum is fixed to be zero. These properties can be later changed in the Modify Axes dialog.
Grid lines will be drawn on the Circumferential and/or Radial axes if the Grid Lines check boxes are checked. The number of circumferential segments is specified in the # Segments field. This field allows even values between 2 and 36. Grid lines for the Radial axis are drawn as concentric circles. The number of circles depends on the value entered in the Interval field for the Radial axis.
The plot may be formatted in a variety of ways. Clicking the spin box arrows to the right side of the Line list box toggles the display through a list of the available line types. Click on the desired line type or make a selection with the up and down arrow keys. The plot symbol and line color are chosen in a similar manner.
When the Automatic update control is selected, the plot will use the current data in the table from which the plot was developed, rather than the data which existed when the plot was first drawn. The data can be plotted from the Parametric, Lookup, Arrays, or Integral tables. Any change in the data will cause the plot to be redrawn before it is displayed.
See also:
Modify Plot
Bar Plot
X-Y-Z Plot