Specify Uncertainty Information
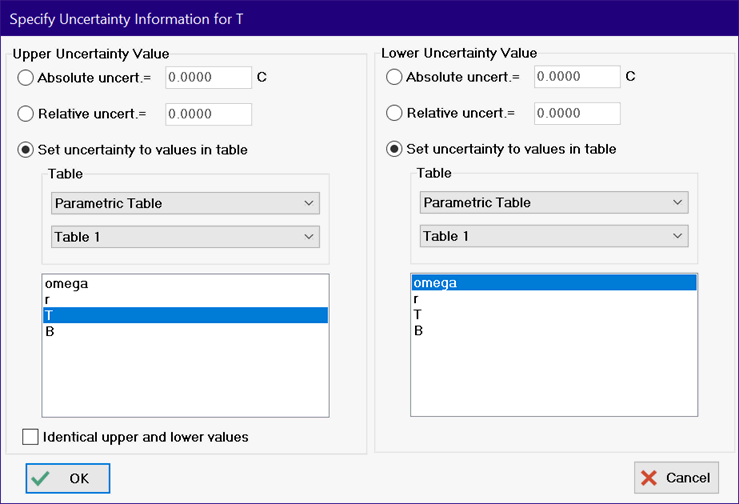
The Specify Uncertainty Information dialog is shown above. This dialog is presented after clicking the X-Axis or Y-Axis check box in the Uncertainty box in the Modify Plot dialog. This dialog allows uncertainty information to be entered for a situation in which the Uncertainty Propagation Table calculations are not used.
The information in this dialog is for a particular variable plotted on the X or Y-axis. In the example shown above, the variable is T. The dialog allows the uncertainty for values of the selected variable to be specified as either a constant that is taken to be the absolute value or relative value, or as a variable that is read from a column in the Parametric, Lookup, Arrays, or Integral tables.
Note: If the specified column in the Parametric table is for a variable that includes uncertainty information (i.e., the column displays information of the form 1.234 ± 0.2345) then the value that follows the ± sign is used for the uncertainty value. Otherwise the value in the column is used for the uncertainty values.
Uncertainty can be displayed on the plot with error bars or with a shaded region, using the controls in the Modify Plot dialog. The uncertainty region is normally drawn symmetrically around the data point. However, it is possible to have an unsymmetric uncertainty region by unchecking the "Identical upper and lower values" check box. In this case, the Specify Uncertainty Information dialog will expand to allow entry of error bar information for the upper and lower legs of the error bars, as shown.
See also: