Uncertainty Propagation Table
This command provides the same function as the Uncertainty Propagation command, namely the determination of the uncertainty propagation for one or more calculated variables. The difference is that this command allows the uncertainty calculations to be repeated for one or more measurements in a selected Parametric Table. Integration can be accomplished using the Parametric table, so the Uncertainty Propagation Table allows the uncertainty of an integral to be determined for a case in which experimental data used in the integral have inherent uncertainty.
The Parametric Table for which calculations will be done can be selected with the drop-down control at the upper right of the dialog. The calculated variables must all be included in the Parametric Table before this command is used. Measured variables (which have defined values) can also be placed in the Parametric table. Alternatively, they may be constants specified by equations in the Equations window. It is common to set one or more measured variables from data in the Lookup Table. This can be accomplished using the Lookup function with the TableRun# variable. For example, in order for a mass flow rate (m_dot) from the Lookup table to be used as one of the variables for the Uncertainty Table calculation, an equation similar to following must be entered in the Equations window.
m_dot=Lookup('myTable',TableRow#,'Flowrate')
Alternatively and preferably, a value such as Row could be used to indicate the row in the Lookup table, provided that values for Row are specified in the Parametric table, e.g.,
m_dot=Lookup('myTable',Row,'Flowrate') {Row has specified values in the Parametric table}
The use of Row instead of TableRow# will result in faster computational speed.
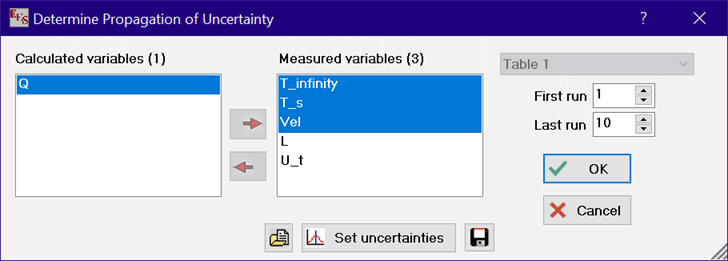
After selecting the command, the Uncertainty Propagation dialog window will appear in which the calculated quantity is selected from list of variables in the left list and the measured variable(s) are selected from the list on the right. Note that all variables that participate in the uncertainty calculations must be in the same Parametric table.
After selecting the Uncertainty Propagation Table menu item, a dialog will appear in which variables in the Parametric table can be selected for the uncertainty calculations, as in the following example.
The uncertainty values associated with the measured variables can be set by clicking the Set uncertainties button.
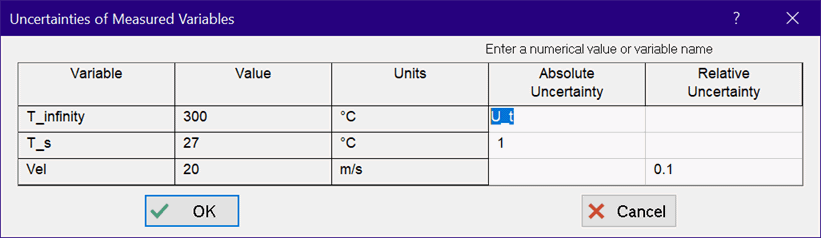
Note that the absolute or relative uncertainty can be specified with a numerical value or with a variable that is defined in either the Parametric table or the Equations window, e.g., U_t in the above example. Also, the uncertainty values can be entered in either the main or the alternate set of units in the Professional license.
In the Professional license, the choices made for the calculated and measured variables and their associated relative or absolute uncertainties can be saved by clicking the Save Uncertainty Information button located to the right of the Set Uncertainties button. These choices can later be restored by clicking the Open Uncertainty Information button at the left of the Set Uncertainties button. Saving the uncertainty information allows one EES file to solve several different uncertainty problems without having to reenter the uncertainty settings. The Save Uncertainty Information saves a text file having an .UNC file name extension. This file can be viewed or edited with a text editor such as Notepad. The .UNC file can also be used in a different EES file. Variables that are in the file but do not appear in the Calculated or Measured variable lists are ignored.
A plot constructed with variables that have associate uncertainty can optionally display error bars or a shaded area corresponding to the uncertainty region. Controls for the display of uncertainty are in the Modify Plot dialog.
The Parametric Table calculations will proceed after the OK button is selected, just as if the Solve Table command were applied. The values and uncertainty for the calculated variable(s) and each measured variable will be displayed in the Parametric Table after the calculations are completed. The calculated variable(s) can then be plotted with error bars representing the propagated uncertainty using the New Plot Window command. If a sum row is displayed in the Parametric table, the uncertainty value shown will be the square root of the sum of the squared values of the uncertainties in all rows. This value is an estimate of the uncertainty of the sum. This value is then the uncertainty of an integral calculated using the table-based integration when there is assigned uncertainty to the integration variable and/or measured variables involved in the determination of the integral. It will be displayed in the Uncertainty tab of the Solution Window followed by the words ' for integral'. The sum row can be made visible or hidden using the Preferences command.
See also: Uncertainty Propagation